MKC2500 Lecture Notes - Lecture 16: Simple Linear Regression, Confidence Interval, Dependent And Independent Variables

18 Jun 2018
School
Department
Course
Professor

ETC2500 Notes
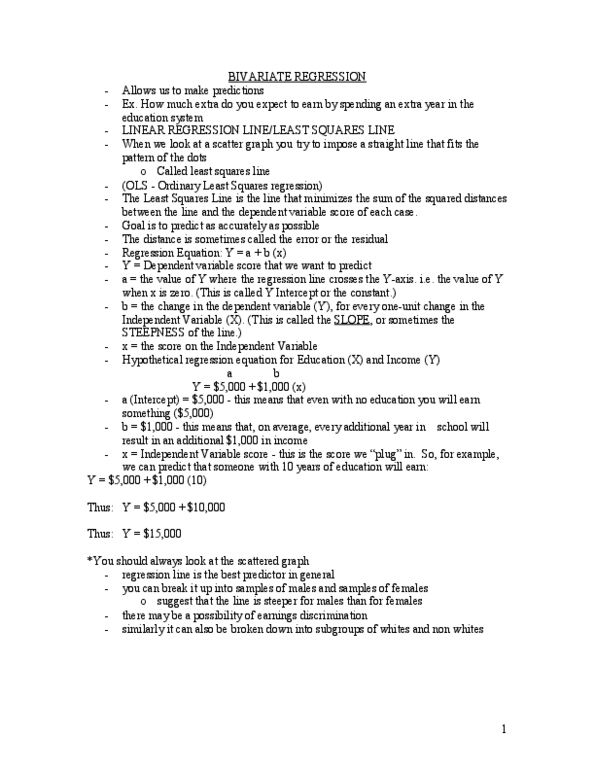
Simple linear regression (Bivariate regression)
• A procedure for deriving an equation for the imperfect but linear relationship
between a single scale dependent variable and a single scale dependent
variable, that should hold on average
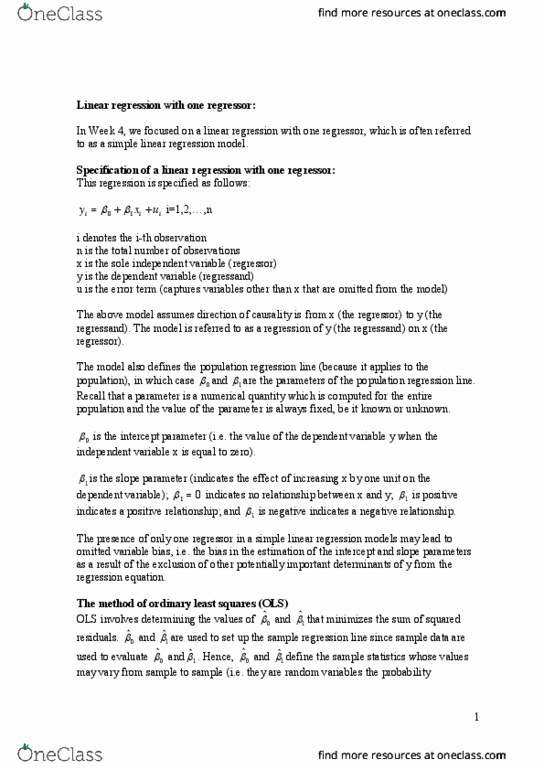
yi = β0 + β1xi +ei
yi is the response variable
xi is the independent variable (can potentially control)
ei is the error term
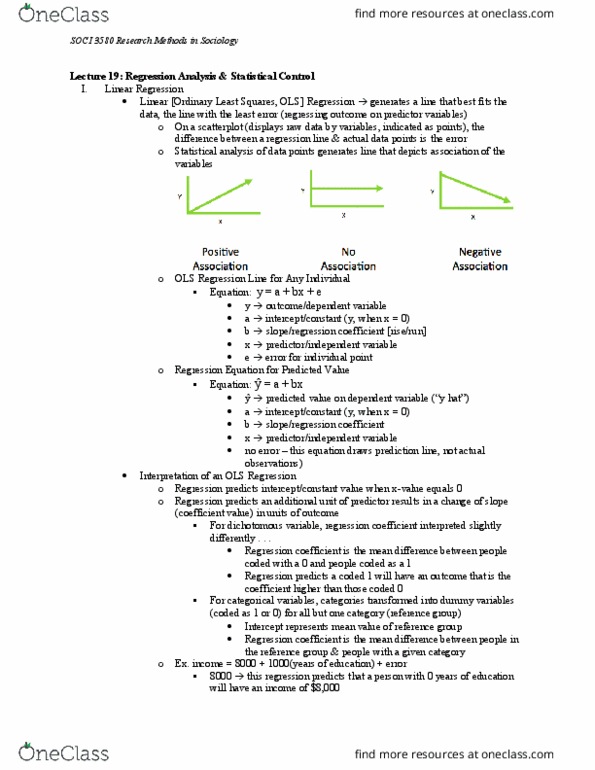
The hypothesized relationship between x and y is given by
β0 + β1x is the expected (or population average) response in y for a given value of
x
The errors e1, e2…: describe the random deviations from the expected line that
can occur in the observed data
β0 is the y-intercept of the expected (or average) response as a function of x
β1 is the slope of the regression line, corresponding to the expected (or average)
increase in y for any given unit increase in x
Ordinary least squares regression
We use ordinary least squares (OLS) estimators of β0 + β1 denoted by b0 and b1
Note that the second equation (for b0) ensures that the estimated regression line will
pass through the point (x, y)
Confidence intervals for β0 and β1 can be obtained) For a given value of x, we predict
y using
Document Summary
The hypothesized relationship between x and y is given by. 0 + 1x is the expected (or population average) response in y for a given value of x. The errors e1, e2 : describe the random deviations from the expected line that can occur in the observed data. 0 is the y-intercept of the expected (or average) response as a function of x. 1 is the slope of the regression line, corresponding to the expected (or average) increase in y for any given unit increase in x. We use ordinary least squares (ols) estimators of 0 + 1 denoted by b0 and b1. Note that the second equation (for b0) ensures that the estimated regression line will pass through the point (x, y) Confidence intervals for 0 and 1 can be obtained) for a given value of x, we predict y using. H0 : 1 = 0 versus h1 : 1 0.