BSB123 Lecture Notes - Lecture 3: Sample Space, Mutual Exclusivity, Conditional Probability


Data Analysis – Bivariate Data & Probability
- Bivariate Data
oTwo sets of data taken to measure relationship
oQualitative
Data is compared in contingency (frequency) tables
Contingency tables cross-tabulate information to examine the
relationship between two qualitative variables
Shows the frequency of occurrences of both variables
Convert into percentages for ease of making observations
oQuantitative
Use scatter plot to measure relationship
Look for form, direction and scatter (positive, negative, strong, weak)
Types of relationships
Positive linear relationship
Negative linear relationship
Curvilinear relationship
No relationship
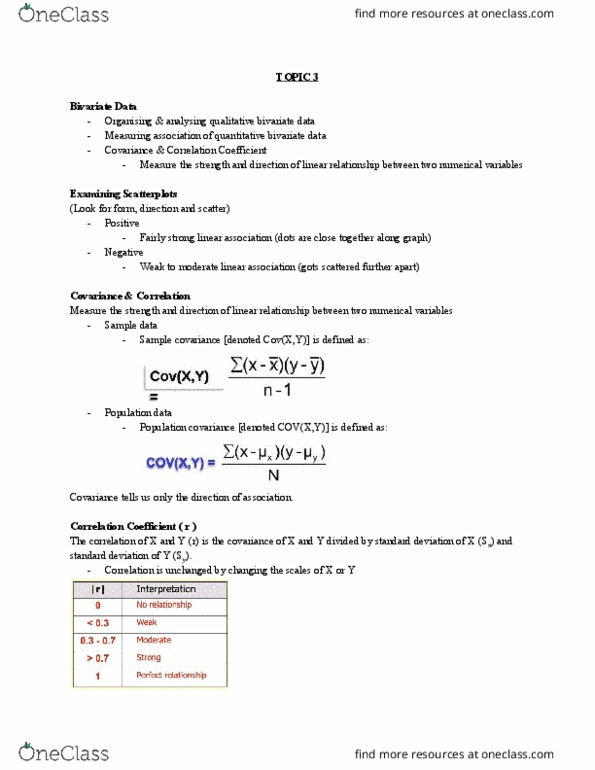
oCovariance
Measure the strength and direction of linear relationship between two
numerical variables
Positive covariance = positive relationship (negative cov = negative r)
Only tells the direction of association, not strength
oCorrelation (r)
Measure of linear association (is it strong or weak)
Uncontaminated by the dispersions of the variables
Between 0-1
0 = no relationship
< 0.3 = weak relationship
0.3 – 0.7 = moderate relationship
> 0.7 = strong relationship
1 = perfect relationship
find more resources at oneclass.com
find more resources at oneclass.com