BUSS1020 Lecture Notes - Lecture 3: Central Tendency, Acronym, Skewness

18 Jul 2018
School
Department
Course
Professor
Document Summary
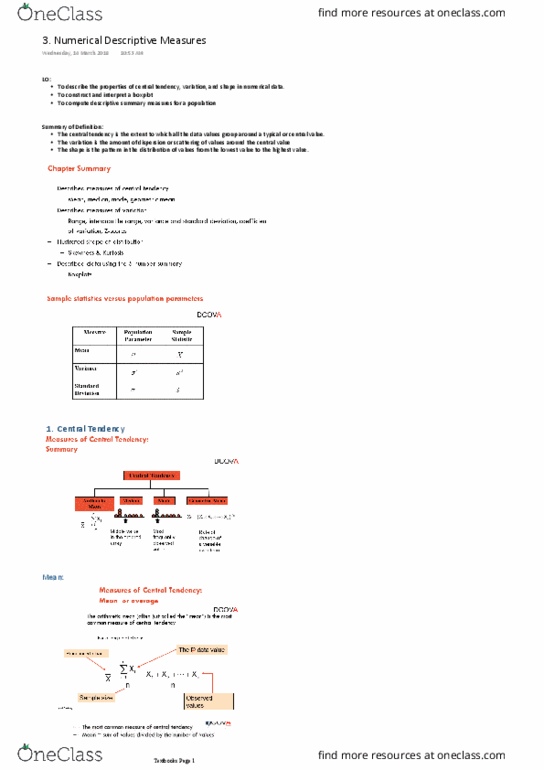
Lecture 3: numerical descriptive measures: textbook chapter 3: When summarising and describing numerical variables, the organising and visualizing methods are only a starting point. Most variables show a distinct tendency to group around a central value. The mean, median, and mode are the three main measures of central tendency. The arithmetic mean (typically referred to as the mean) is the most common measure of central tendency. The mean can suggest a typical or central value and serves as a balance point in a set of data. You compute the mean by adding together all the values and then dividing that sum by the number of values in the data set. The symbol called x-bar, is used to represent the mean of a sample. For a sample containing n values, the equation for the mean of a sample is written as: