BUSS1020 Lecture Notes - Lecture 13: Simple Linear Regression, Confidence Interval, F-Test

18 Jul 2018
School
Department
Course
Professor
Document Summary
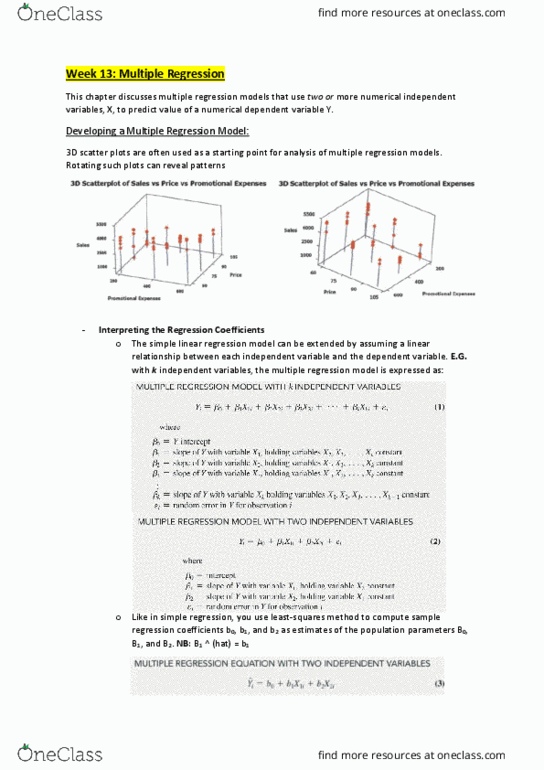
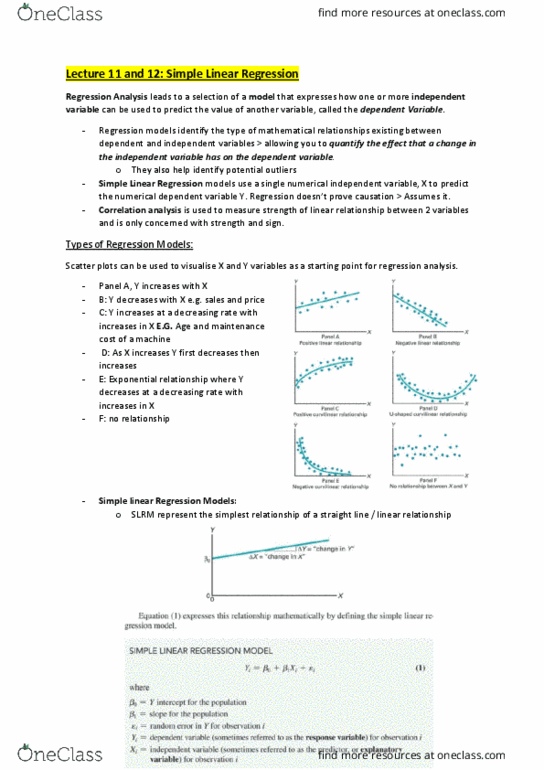
See roadmap at the last page of notes 1st for understanding. Simple linear regression models use one numerical independent variable, x, to predict the value of a numerical dependent variable, y. However, you often can make better predictions by using more than one independent variable. Multiple regression models use two or more independent variables (x1, x2, x3 . ) to predict the value of a dependent variable (y). Above: excel output. r2, adjusted r2, and the overall f test: In multiple regression, the coefficient of multiple determination (r2) represents the proportion of the variation in y that is explained by all the independent variables. The adjusted r2 shows the proportion of variation in y explained by all x variables adjusted for the number of x variables used. Compares two unbiased estimates of variation and asks by how much is the estimate of var(y|x) < var (y).