BUSS1020 Lecture Notes - Lecture 4: Quartile, Empirical Probability, Box Plot

19 Jul 2018
School
Department
Course
Professor
Document Summary
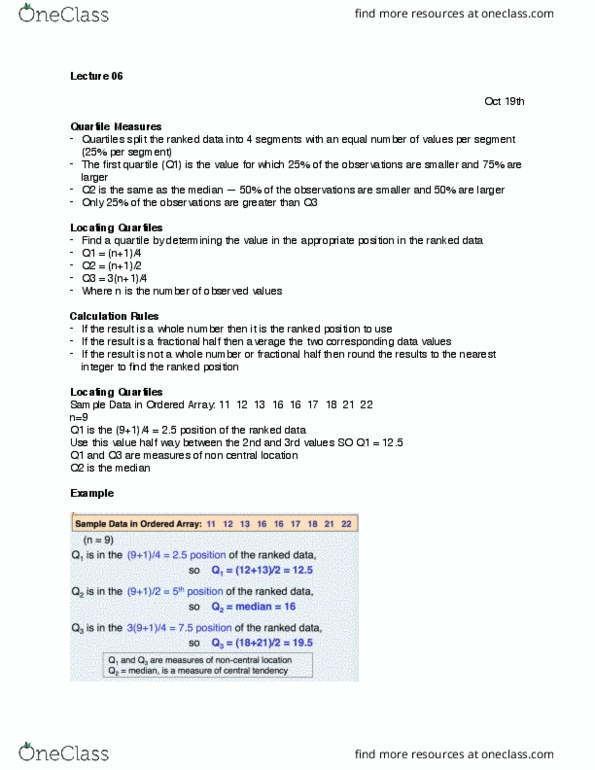
Quartiles split the ranked data into 4 segments, with an equal number of values per segment. The first quartile, q1, is the value for which 25% of the observations are smaller, and. Only 25% of the observations are greater than the third quartile, q3. Find a quartile by determining the value in the appropriate position in the ranked data, where: Where (cid:858)(cid:374)(cid:859) is the (cid:374)u(cid:373)ber of observed values. When calculating the ranked position use the following rules: If the result is a whle number, then it is ranked to the position to use. If the result is a fractional half, then average the two corresponding data values (2. 5, 7. 5, 8. 5) If the result is not a whole number or a frational half, then round the result to the nearest interger to find the ranked position (1. 25 1; 5. 75 6) The iqr measures the spread in the middle 50% of the data. The iqr is also called the mid-spread.