BUSS1020 Lecture Notes - Lecture 8: Standard Deviation, Probability Plot, Sample Size Determination

27 Jul 2018
School
Department
Course
Professor
Document Summary
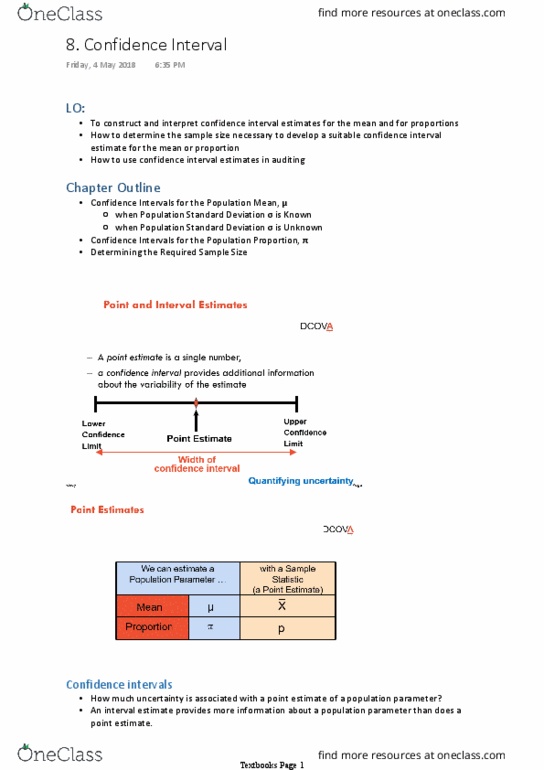
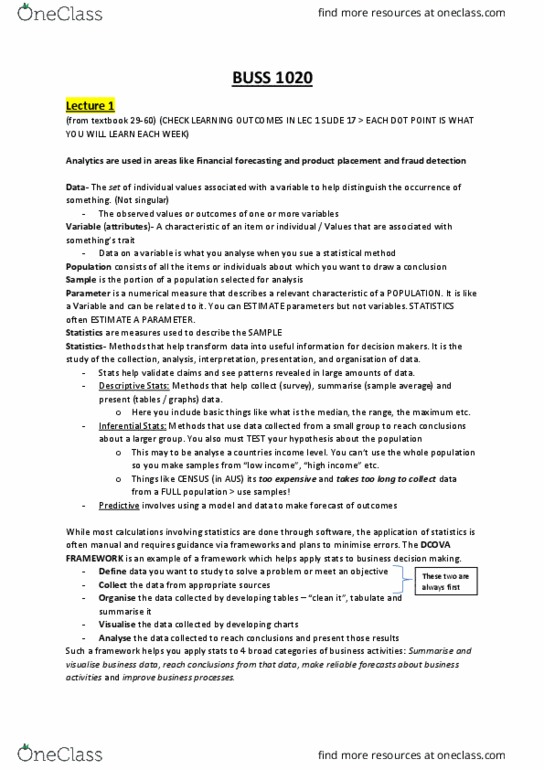
Confidence interval provides additional information about variability of estimate. How much uncertainty is associated with a point estimate of a population parameter. Interval estimate provides more information about a population parameter than does a point estimate confidence interval. Our confidence that the interval will contain the unknown population parameter (percentage < 100%) Point and interval estimate for mean ( is unknown) If is known, then can also be known (need mean to calculate sd) Student-t distribution (mean = 0, variance = 1) If population sd is unknown, can sub sample sd, s: extra uncertainty s varies in different samples, normally use student-t distribution instead of normal distribution. Assumptions: population sd is unknown, population is normally distributed. If population is not normal, use large sample (clt still works) Interpreting interval requires assumption that clt holds i. e. n is large enough or population distribution is normal. Normality of population can be assessed by: normal probability plot, qqplot, histogram.