BUSS1020 Lecture Notes - Lecture 6: Central Limit Theorem, Box Plot, Interquartile Range

27 Jul 2018
School
Department
Course
Professor
Document Summary
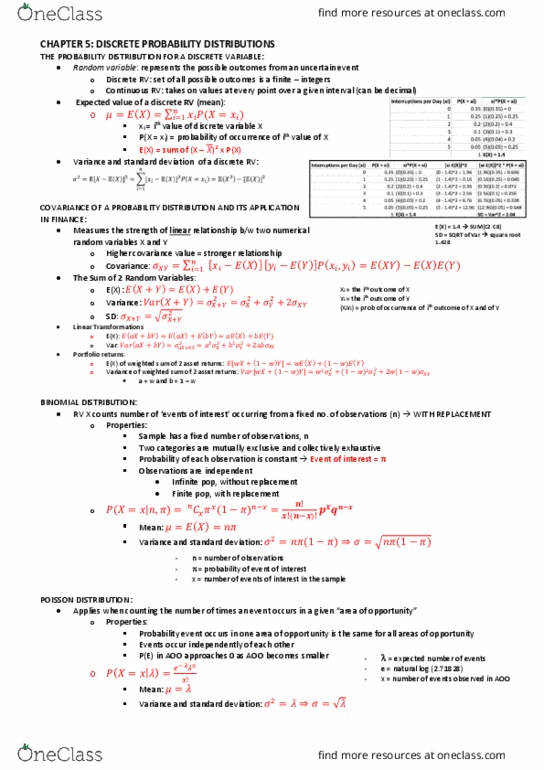
Covariance of a probability distribution and its application in finance (chapter 5. 2) This introduces the covariance between 2 variables, applied to portfolio management. Nb: use the standard deviation equation for discrete variables pg19. Covariance: covariance of a probability distribution (uxy) measures the strength of the relationship between 2 variables, x and y. It measures strength of linear relationship between probability distributions of 2 variables whereas sample covariance measures strength of linear rel between 2 numerical variables: positive covariance indicates a positive relationship and negative. Covariance indicates negative relationship (varying in opposite direction). If 2 variables are independent, their covariance will be zero. Expected value, variance and standard deviation of the sum of 2 variables: Expected value of each variable (investment) is the sa(cid:373)e as (cid:862)e(cid:454)pe(cid:272)ted (cid:396)etu(cid:396)(cid:374)(cid:863) fo(cid:396) ea(cid:272)h variable. Portfolio expected return and portfolio risk: the above equations can be applied to analysing portfolios, or groupings of assets made for investment purpose.