STAT1008 Lecture Notes - Lecture 1: Dependent And Independent Variables, Statistical Inference, Attention Deficit Hyperactivity Disorder


STAT1008 QUANTITATIVE RESEARCH METHODS
- StatKey – online interactive tool to accompany textbook. Lock5statcom
- Swirlstats.com
L1.2
THE STRUCTURE OF DATA
- Data: data is a set of measurements taken on a set of individual units, cases, participants.
- Usually data is stored ad preseted i a data ….
Cases and Variables
- We obtain info about cases or units
- A variable is any characteristic that is recorded for each cases
- Generally each case makes up a row in a dataset, and each variable makes up a column
- In the real world data is never clean e.g. people not wanting to give data, data missing ..
Thinking of our results
- What are the various variables?
- Which are the case?
- Can you think of some interesting questions that you can answer with the dataset?
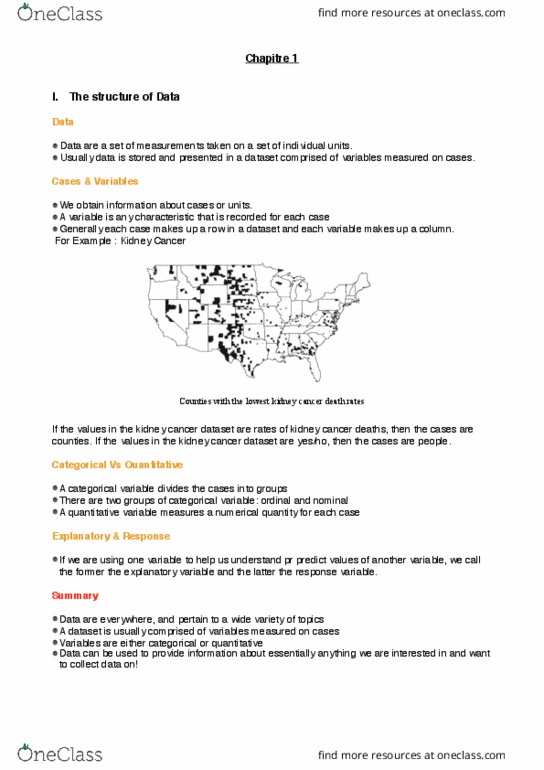
- Data can be represented with maps/pictures
Categorical versus Quantitative
- A categorical variable divides the cases into groups e.g gender
- A quantitative variable measure a numerical quantity for each case e.g height
- Classif eah of the folloig ariales ….]
- E.g. number of hours per week is categorical because it did not require you to specify the no. of hours.
Using data to answer a question – Data can be used to answer interesting questions!
Explanatory and Response
- If we are using one variable to help us understand or predict values of another variable, we call the
former the explanatory variable and the latter the response variable
- Examples:
o Does meditation help reduce stress?
o Does sugar consumption increase hyperactivity?
o Explanatory
o Response
o
SAMPLING FROM A POPULATION
find more resources at oneclass.com
find more resources at oneclass.com

L1.3
Sample versus Population
- A population includes all individuals or objects of interest
- A sample is all the cases that we have collected data on (a subset of the population)
- Statistical inference is the process of using data from a sample to gain information about the
population.
- Population → Sampling → Sample → Statistical inference
o I order to ake statistial iferee ou eed to ake sure saple is good ad aoid ias’
- Inference is getting information about the population.
Student Life
- Suppose researchers studying life at ANU use you (students in this class) to investigate what students
find important.
o What is the sample?
o What is the population?
- Can this sample data be generalized to make inferences about the population? Why or why not?
Sampling Bias
- Sampling Bias occurs when the method of selecting a sample causes the sample to differ from the
population in some relevant way.
- If sampling bias exists, we cannot trust generalizations from the sample to the population
- Goal: Select a sample that is similar to the population, only smaller in size
Can you avoid sampling bias? → Random Sampling
Random Sampling
- Technology is used
Random vs Non-Random Sampling
- Random samples have averages that are centered arount the correct number
- Non-random samples may suffer from sampling bias, and averages may not be centered around the
correct number
- Only random samples can truly be trusted when making generalizations to the population
Simple Random Sampling
- In a simple random sample, each unit of population has the same chance of being selected, regardless
of the other unites chosen for the sample
- More complicated random sampling schemes exist, but will not be covered in this course
Realities of Sampling
- While a rado saple is ideal, ofte it is’t feasile. A list of the etire populatio a ot e
available, or it may be impossible or too difficult to contact all members of the population.
find more resources at oneclass.com
find more resources at oneclass.com
Document Summary
Statkey online interactive tool to accompany textbook. Data: data is a set of measurements taken on a set of individual units, cases, participants. Usually data is stored a(cid:374)d prese(cid:374)ted i(cid:374) a data . We obtain info about cases or units. A variable is any characteristic that is recorded for each cases. Generally each case makes up a row in a dataset, and each variable makes up a column. In the real world data is never clean e. g. people not wanting to give data, data missing A categorical variable divides the cases into groups e. g gender. A quantitative variable measure a numerical quantity for each case e. g height. Classif(cid:455) ea(cid:272)h of the follo(cid:449)i(cid:374)g (cid:448)aria(cid:271)les . ] E. g. number of hours per week is categorical because it did not require you to specify the no. of hours. Using data to answer a question data can be used to answer interesting questions!