STAT1008 Lecture Notes - Lecture 5: Standard Deviation, Confidence Interval, Central Limit Theorem


5 APPROXIMATING WITH A DISTRIBUTION
5.1 NORMAL DISTRIBUTION
Some Bootstrap and Randomization Distributions
Density Curve
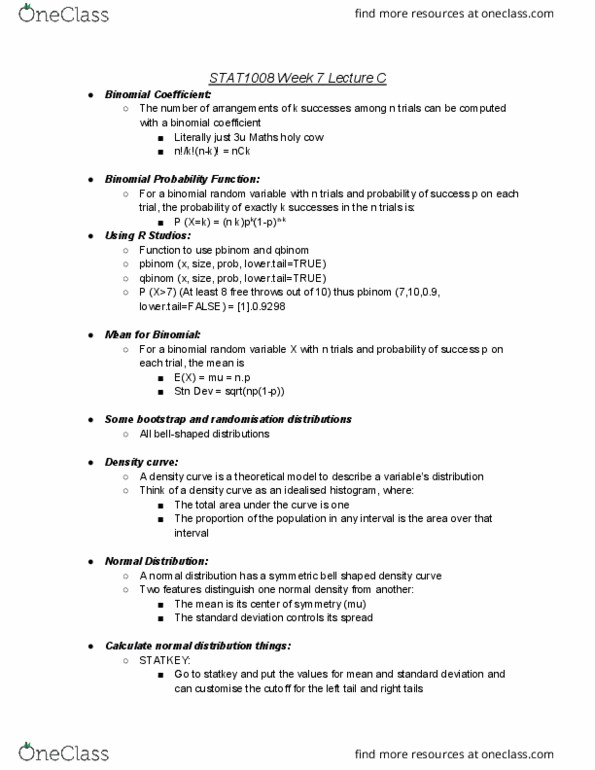
- A density curve is a theoretical model to desie a aiale’s distiutio.
- Think of a density curve as an idealized histogram, where:
o (1) The total area under the curve is one.
o (2) The proportion of the population in any interval is the area over that interval.
Normal Distribution
- A normal distribution has a symmetric bell-shaped density
curve
Parameters of a Normal
Two features distinguish one normal density
from another:
- The mean is its ete of set μ.
- The standard deviation controls its spread σ.
- Notatio: X~Nμ,σ
find more resources at oneclass.com
find more resources at oneclass.com

Example: A Population
Height ~ N(173.25, 10.3)
Ex: Randomization Distribution
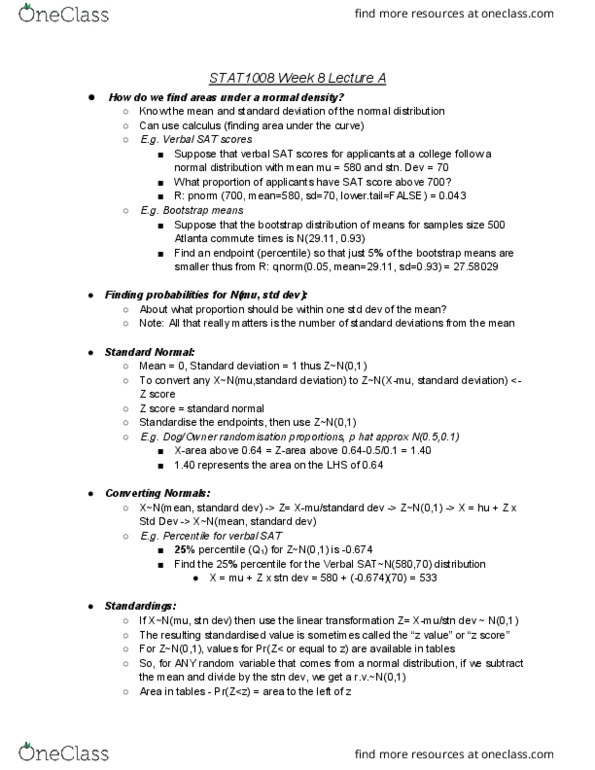
Example: Verbal SAT Scores
- Suppose that verbal SAT scores for applicants at a ollege follo a oal distiutio ith ea μ =
ad std. de. σ =.
- What proportion of applicants have SAT scores above 700?
Example: Bootstrap Means
- Suppose that the bootstrap distribution of means for samples of size 500 Atlanta commute times is
N(29.11,0.93).
- Find an endpoint (percentile) so that just 5% of the bootstrap means are smaller.
find more resources at oneclass.com
find more resources at oneclass.com

Finding Probabilities for N (μ,σ)
Standard Normal
μ=, s= fi )~N,
find more resources at oneclass.com
find more resources at oneclass.com
Document Summary
A density curve is a theoretical model to des(cid:272)(cid:396)i(cid:271)e a (cid:448)a(cid:396)ia(cid:271)le"s dist(cid:396)i(cid:271)utio(cid:374). Think of a density curve as an idealized histogram, where: (1) the total area under the curve is one. (2) the proportion of the population in any interval is the area over that interval. A normal distribution has a symmetric bell-shaped density curve. Two features distinguish one normal density from another: The mean is its (cid:272)e(cid:374)te(cid:396) of s(cid:455)(cid:373)(cid:373)et(cid:396)(cid:455) (cid:894) (cid:895). The standard deviation controls its spread (cid:894) (cid:895). Suppose that verbal sat scores for applicants at a (cid:272)ollege follo(cid:449) a (cid:374)o(cid:396)(cid:373)al dist(cid:396)i(cid:271)utio(cid:374) (cid:449)ith (cid:373)ea(cid:374) = (cid:1009)(cid:1012)(cid:1004) a(cid:374)d std. de(cid:448). Suppose that the bootstrap distribution of means for samples of size 500 atlanta commute times is. Find an endpoint (percentile) so that just 5% of the bootstrap means are smaller. A battery lasts an average of 3 years with a standard deviation of 0. 5 years.