BSB123 Lecture Notes - Lecture 9: Total Variation, Linear Regression, Statistical Hypothesis Testing


Simple Regression
- Regression analysis
oAbout finding and quantifying the straight-line relationship between two or more
variables
oTechnique to determine the causal relationship between the response variable
(Dependant variable = Y) and the explanatory variables (Independent variable = X)
oFrom this, it is possible to determine how much changes in one variable are likely o
affect, or cause, changes in the other variable
oHelps businesses plan their strategies in several ways. Examples include:
Knowing how advertising expenditure has affected sales in the past can help
the firm decide how much advertising expenditure to make in the future
Knowing the relationship between the quantity of defective products
produced and the maintenance expenditures of a firm might help to
determine an optimal maintenance strategy
Knowing how sales have been affected by price changes in the past may
help the firm predict the effect of future price changes on revenue and
profit
Knowing the relationship between income and sales of a product may help a
firm to develop a marketing and distribution strategy
- Y = f*(X, ε) (one independent variable only)
- The first step in a regression analysis is to graph the data
oIllustrates whether any kind of relationship exists
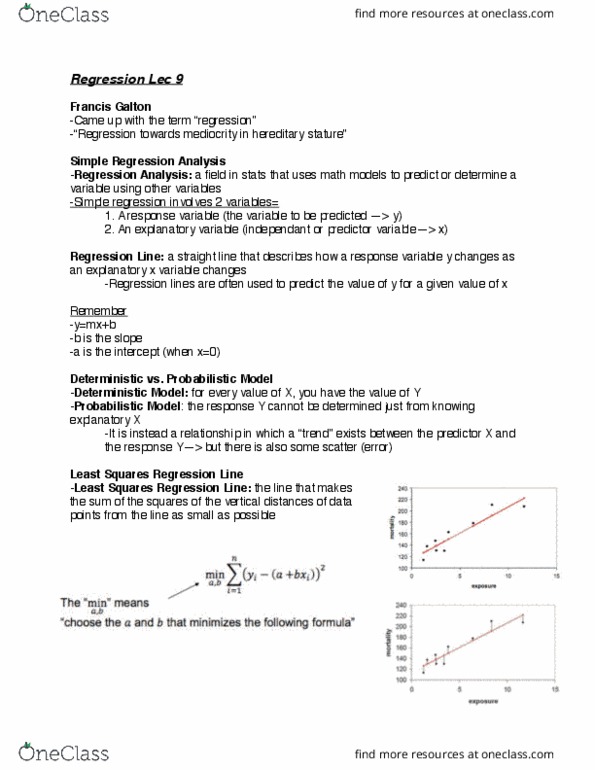
- Least squares method
oThe best fit line will be the one that minimises the sum of squared errors
oSum of Squared Errors (SSE) = ∑e2
- Using line of best fit
oQuantifies the relationship through a straight-line equation that best describes the
observed relationship
oLine should be in the centre of all the observations
oThe line should be such that the distance of points off the line is as small as possible
(error term is minimised)
oY = c + mx
oc = the value that Y will take on when X = 0
om = the direct effect of X on Y (the rate at which Y changes if X changes by one unit)
- Regression estimate (best fit line)
find more resources at oneclass.com
find more resources at oneclass.com
Document Summary
Knowing how advertising expenditure has affected sales in the past can help the firm decide how much advertising expenditure to make in the future. Knowing the relationship between the quantity of defective products produced and the maintenance expenditures of a firm might help to determine an optimal maintenance strategy. Knowing how sales have been affected by price changes in the past may help the firm predict the effect of future price changes on revenue and profit. Knowing the relationship between income and sales of a product may help a firm to develop a marketing and distribution strategy. Y = f*(x, ) (one independent variable only) The first step in a regression analysis is to graph the data: illustrates whether any kind of relationship exists. Least squares method: the best fit line will be the one that minimises the sum of squared errors, sum of squared errors (sse) = e2.