BSB123 Lecture Notes - Lecture 11: Time Series, Sample Size Determination, Point Estimation

Document Summary
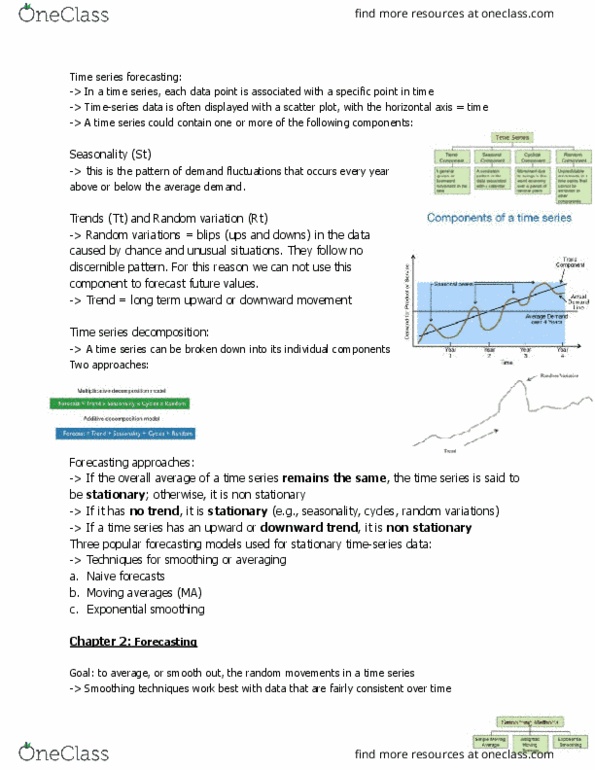
Equal time intervals (years, quarters, months, weeks, etc) Data collected through time on a regular basis. Example: gdp, cpi, exchange rate, stock prices, sales/profit, absentee rate . Detect and quantify patterns from past data. Use the patterns to forecast future values. Relatively smooth long-term increase or decrease of a series. Ups and downs around trend not related to consistent calendar events; duration > a year. Regular variation around trend based upon events consistent in each calendar year. Irregular component based upon unusual or unpredictable events. Multiplicative model y = t x s x c x r. Additive model y = t + s + c + r. In this unit, we will focus on multiplicative model to analyse trend, cyclical and seasonal effects. The cyclical effect is usually expressed as % of trend. % of trend = (actual value / predicted value) x 100% = y/y(hat) x 100%