BSB123 Lecture Notes - Lecture 8: Atomic Orbital, Null Hypothesis, Statistic

Document Summary
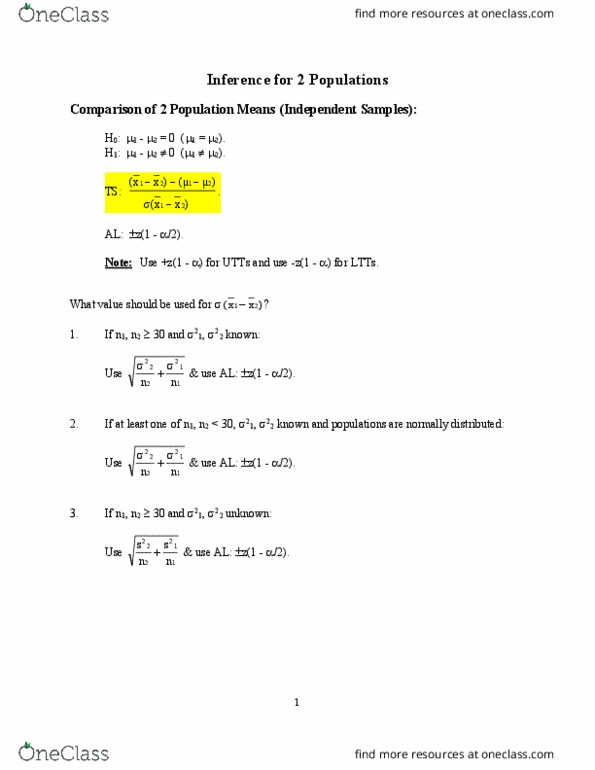
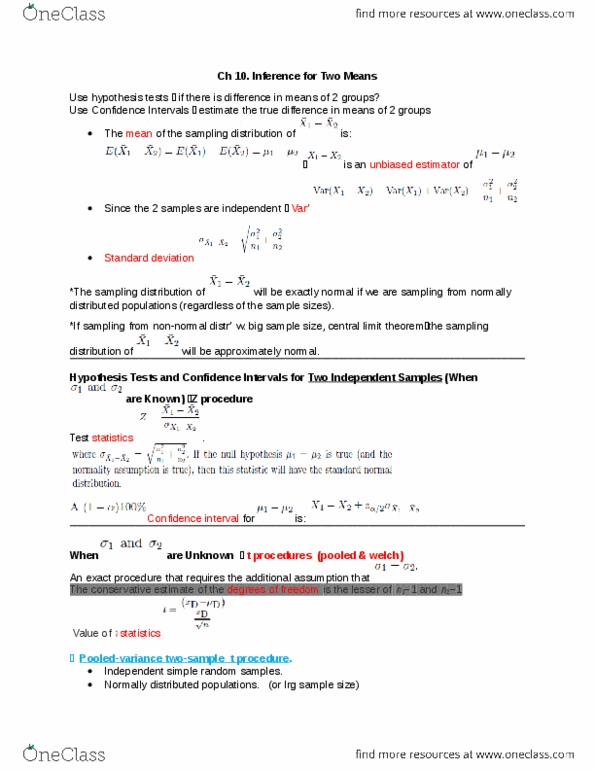
Technical note the sample standard deviation, s, follows a chi-square distribution and x follows a z-distribution. When a z-distribution is divided by a chi-square distribution, the result is a t-distribution. To conduct a test using the p-value approach, we have to find out the p-value. In z-test we can use the z table to find out the p-value. But in t-test the t table does not give us the exact p-value. (it gives us a range of p-value) Therefore to conduct a t-test using the p-value approach, we have to use excel to obtain the exact p-value. (cid:541)1=(cid:541)2 (cid:541)1 (cid:541)2. The two-sample t-test for unpaired data is defined as . Test statistic t=y1 y2 s21/n1+s22/n2 where n1 and n2 are the sample sizes, y1 and y2 are the sample means, and s21 and s22 are the sample variances. If equal variances are assumed, then the formula reduces to .