PSYC3311 Lecture Notes - Lecture 4: Spectrogram, Vocal Tract, Sound


Week 2 lec 2
Articulation – actual pronunciation of the sound
Now – how acoustic signal gets turned into the auditory (equivalent) . how do we interpret what the
signal is telling us
SPEECH RECOGNITION
We will next look at how the physical (acoustic) signal is translated into its perceptual (auditory)
interpretation.
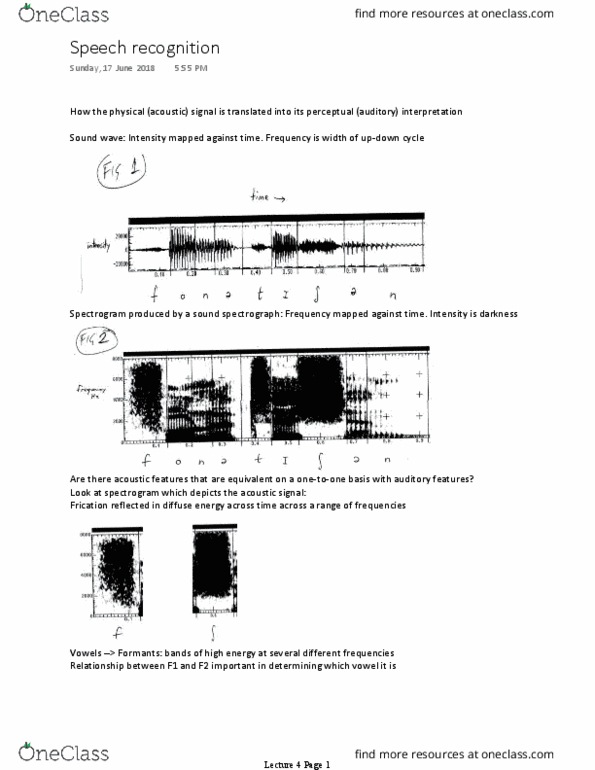
Sound wave: Intensity mapped against time. Frequency is width of up-down cycle (see Fig 1).
If the vocal apparatus was a straight tube coming from the mouth, the height of the wave –
intensity of signal, Frequency is the frequency of the ups and downs. X axis is time
Intensity comes out as loudness, frequency - pitch
Idealised ^
Cos human vocal tract has cavities, obstructions etc.
The fig 1 is what sound wave looks like for speech signal for the word fonetisian
Spectrogram produced by a sound spectrograph: Frequency mapped against time. Intensity is
darkness. (see Fig 2)
Are there acoustic features that are equivalent on a one-to-one basis with auditory features?
Look at spectrogram which depicts the acoustic signal:
/f/ and /∫/. Frication reflected in diffuse energy across time across a range of frequencies. /∫/ is
more intense than /f/.
It’s like oise . fricatives – f and sh. The sh is more intense than the f
find more resources at oneclass.com
find more resources at oneclass.com
Document Summary
Now how acoustic signal gets turned into the auditory (equivalent) . how do we interpret what the signal is telling us. We will next look at how the physical (acoustic) signal is translated into its perceptual (auditory) interpretation. Frequency is width of up-down cycle (see fig 1). If the vocal apparatus was a straight tube coming from the mouth, the height of the wave intensity of signal, frequency is the frequency of the ups and downs. Intensity comes out as loudness, frequency - pitch. Cos human vocal tract has cavities, obstructions etc. The fig 1 is what sound wave looks like for speech signal for the word fonetisian. Spectrogram produced by a sound spectrograph: frequency mapped against time. Look at spectrogram which depicts the acoustic signal: Frication reflected in diffuse energy across time across a range of frequencies. It"s like (cid:374)oise . fricatives f and sh. The sh is more intense than the f.