PUBH2007 Lecture Notes - Lecture 1: Normal Distribution, Gamma Distribution, Underweight


PUBH2007 LECTURE ONE
Ephasis is o statistial liteay
• Conceptual understanding of methods used in health and medical research
• Confidence in interpreting data and statistical analysis correctly.
"Case by variable format" required by most software
I.E. Where data is shown in a spreadsheet:
Cases = ROWS = all measurements for that individual person/object
Variables = COLUMNS = measures of characteristic/measurement for all cases
Cells = all cases x all variables
Getting data ready for analysis:
Analysis is performed on variables (columns) with id numbers for privacy
Variables:
• Categorical (groups, e.g. smoker/non-smoker)
• Quantitative (numerical, e.g. age/weight)
Variable
type
Graphical summary
Numerical summary
Categorical
Bar chart
• In order of frequency = Pareto chart
• Horizontal = easier to read category labels
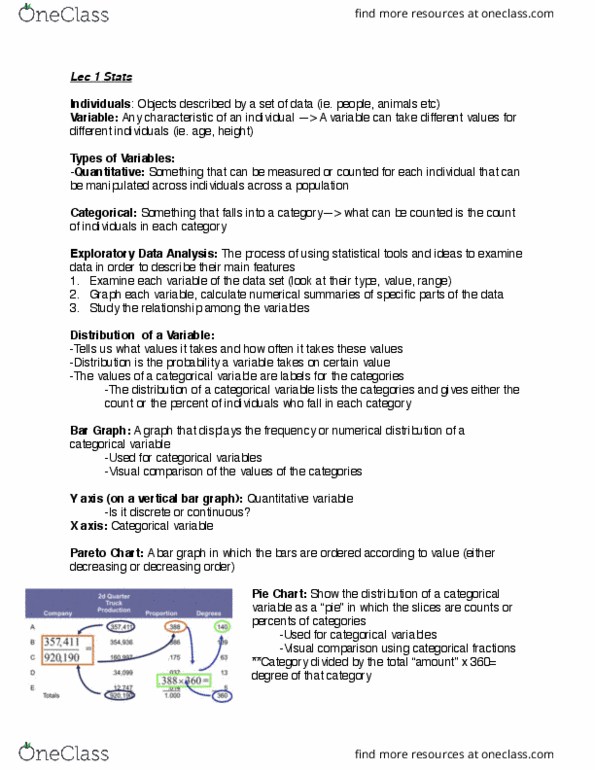
Pie chart (use with caution)
Numbers (N) and % in each
category
Quantitative
Histogram
• Best for large sample
• Divide range of values into intervals or classes of
equal width if possible
• Classify each observation into a class
• WIDTH OF BAR = CLASS INTERVAL
• HEIGHT OF BAR = NUMBER OR % IN CLASS
Box-plot
Centre - mean, median
Spread - range, quartiles,
standard deviation
E.G. Birth weight data set
Quantitative variable = BMI
find more resources at oneclass.com
find more resources at oneclass.com