MATH1005 Lecture Notes - Lecture 3: Mathematical Notation, Box Plot

25 Aug 2018
School
Department
Course
Professor

CODING LANGUAGE
dim(data) - Dimensions of the data provided, from rows to columns.
str(data) - Structure of the data, indicating the variables, and data.
USING NEWTOWN DATA
Due to the size of the data, it is best to present the data through histograms and
boxplots. This would better display the variables in groups.
ADVANTAGES OF NUMERICAL SUMMARIES
It reduces all the data to 1 simple number
- It loses a lot of information
- Easy to communicate and present comparisons
Majors
- Maximum
- Minimum
- Centre
- Spread
USEFUL NOTATION
The course is supposed to use words, so care about the language and the data
used.
However, there is some simple mathematical notation that is helpful. For example
sum: where the x represents the data, and n represent the data size.
∑i=1nxi
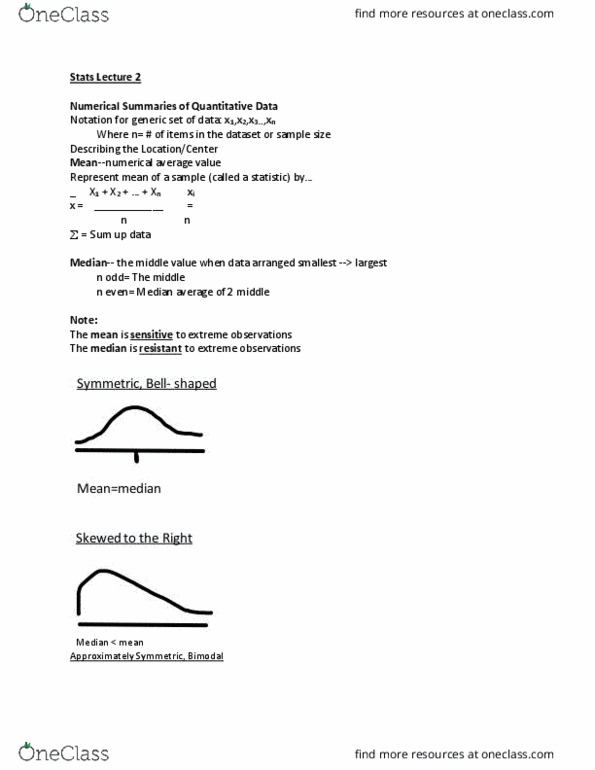
MEAN AND MEDIAN
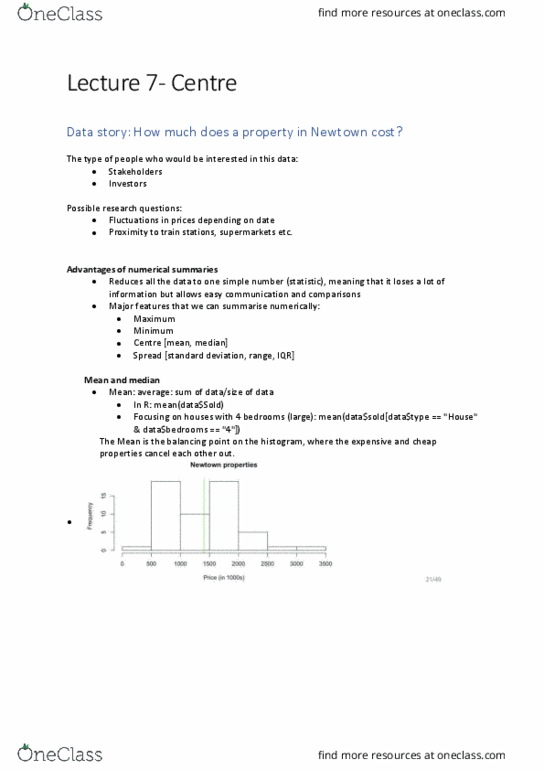
Mean: The mean is the unique point at which the data is balanced, where the
expensive and “cheap” properties cancel each other. The higher and lower readings
all cancel each other out.
Mean = sum of data / size of data.
(general code)
mean(data$Sold)
or (for specific on house and size)
mean(data$Sold[data$Type == "House" & data$Bedrooms == "4"])
NOTE: This is how you produce a line to show an exact data size.
abline(v = mean(data$Sold), col = "green")
Median = average of two middle points (even) or the unique middle point (odd)
(general code)
median(data$Sold)
Document Summary
Coding language dim(data) - dimensions of the data provided, from rows to columns. str(data) - structure of the data, indicating the variables, and data. Due to the size of the data, it is best to present the data through histograms and boxplots. This would better display the variables in groups. It reduces all the data to 1 simple number. The course is supposed to use words, so care about the language and the data used. However, there is some simple mathematical notation that is helpful. For example sum: where the x represents the data, and n represent the data size. Mean: the mean is the unique point at which the data is balanced, where the expensive and cheap properties cancel each other. The higher and lower readings all cancel each other out. Mean = sum of data / size of data. (general code) mean(data) or (for specific on house and size) mean(data[data == house & data == 4])