HTHSCI 2S03 Lecture Notes - Lecture 2: Central Tendency, Standard Deviation, Skewness

26 May 2018
School
Department
Course
Professor

2S03: Session 2
Descriptive Statistics,
Introduction to Probability
Descriptive Statistics
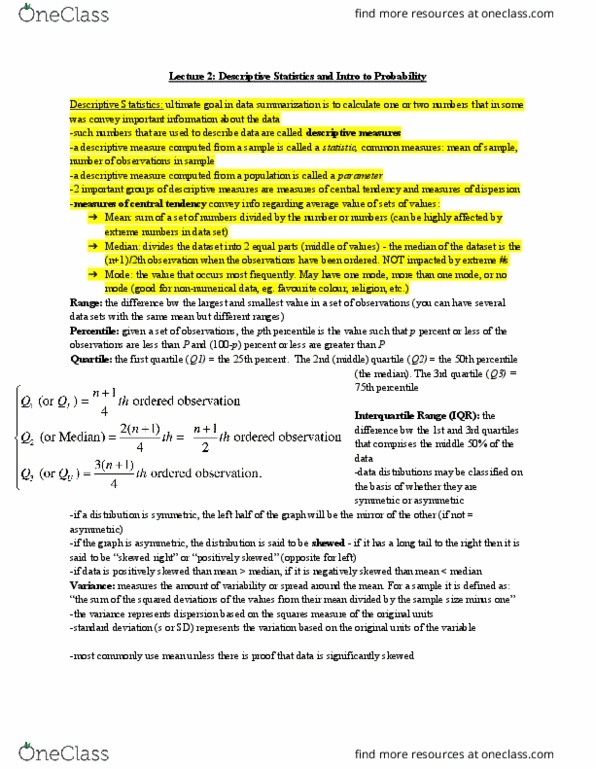
• The ultimate goal in data summarization is to calculate one or two numbers that in some way
convey important information about the data
• Such numbers that are used to describe data are called descriptive measures
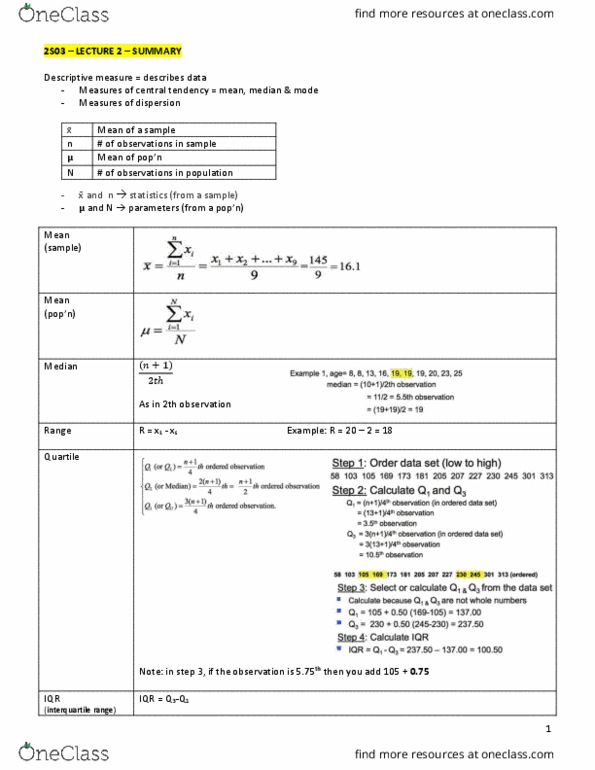
• A descriptive measure computed from a sample is called statistics
o Population: N
o Sample: n
o Mean of a sample: xbar
o Number of observations in sample
• A descriptive measure computed from a population is called a parameter:
o Mean of a population: u
o Number of observations in population
• The two important groups of descriptive measures are measures of central tendency and
measures of dispersion
• Measures of central tendency convey information regarding the average value of a set of values;
the aeage a e defied i diffeet as.
• The three most commonly used measures of central tendency are the mean, the median, and
the mode.
Descriptive Statistics Mean
Mean (Arithmetic mean): the sum of a set of numbers divided by the number of the numbers
o Example 1: these data show the age of a sample of 9 patients with cystic fibrosis
o 8, 19, 19, 20, 13, 8, 16, 19, 23
o n =9
o ea= +++…+/=/=. eas
A general formula for mean: If a random variable in the population is shown by X and a realization of it
(an observation) from a sample is x, then to distinguish between the different observations we assign a
subscript to each.
o For instance in Example 1, x1 = , = … =
o Xi: add each age (all pieces of collected data added together)
o x1= individual pieces of data
o n =number of people in the sample
find more resources at oneclass.com
find more resources at oneclass.com

Properties of the Mean
Population
u = sum of
xi = each variable
N= total number of data
1. Uniqueness- there is always only one mean
2. Simplicity- relatively easy calculation
3. Affected by extreme values- an outlier will skew the data
Example: Income for sample of 5 families: 20k, 25k, 22k, 23k, 200k -> X= 58K
Not an accurate representation of the data
Descriptive Statistics- Median
Median: the median of a dataset divides the dataset into two equal parts such that the number of
values equal to or greater than the median is equal to the number of values equal to or less than the
median. The median of a dataset is the (n+1)/2th observation when the observations have been
ordered.
(n +1)/2 tells you where to look for the median
Example 1, age= 8, 8, 13, 16, 19, 19, 19, 20, 23
median = (9+1)/2th observation
= 10/2 = 5th observation
= 19
Properties of the Median:
1. Uniqueness- only one median for a data
2. Simplicity- simple calculation
3. Not affected by the extreme values- outlies do’t ske data
Income for 5 families: 20k, 25k, 22k, 23k, 200k
median= (5+1)/2th observation = 3rd observation = 23k.
Descriptive Statistics Median - Even Number of Observations
Example 1, age= 8, 8, 13, 16, 19, 19, 19, 20, 23, 25
find more resources at oneclass.com
find more resources at oneclass.com

median = (10+1)/2th observation
= 11/2 = 5.5th observation
= (19+19)/2 = 19
Mode
Mode: the mode of a set of values is the value that occurs most frequently. A set of values may have no
mode, one mode, or more than one mode.
In Example,.
8, 19, 19, 20, 13, 8, 16, 19, 23 mode= 19
8, 19, 19, 20, 13, 8, 16, 20, 23 mode= 8,19, & 20
8, 19, 20, 13, 16, 23 no mode
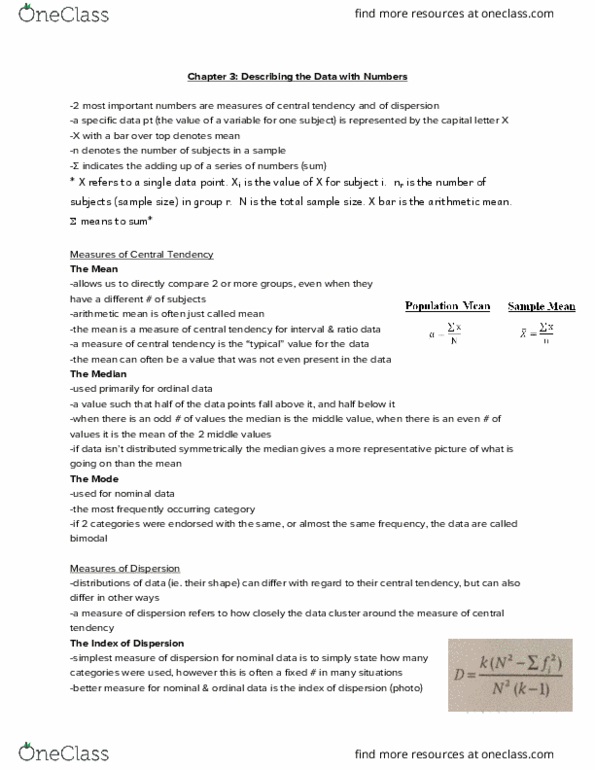
Descriptive Statistics Measures of dispersion
Why do we need a measure for dispersion?
3 datasets with mean= 15:
15, 15, 15, 15, 15
13, 14, 15, 16, 17
10, 12, 15, 18, 20
• A measure of dispersion conveys information regarding the amount of variability present in a
set of data. There will be no dispersion if all the values are the same.
• Not unique- unlike mean and median, you can have more than 1 mode
Descriptive Statistics- Range
Range is the difference between the largest and the smallest value in a set of observations
Distance between the max and min value
R = xL– Xs
For the values of 2, 5, 8, 4, 20, 13, 20 the range is:
R= Xl – Xs = 20 – 2= 18
Descriptive Statistics- Percentiles and Quartiles
find more resources at oneclass.com
find more resources at oneclass.com
Document Summary
For instance in example 1, x1 = (cid:1012), (cid:454)(cid:1006) = (cid:1005)(cid:1013) (cid:454)(cid:1013) = (cid:1006)(cid:1007: xi: add each age (all pieces of collected data added together, x1= individual pieces of data, n =number of people in the sample. Population u = sum of xi = each variable. N= total number of data: uniqueness- there is always only one mean, simplicity- relatively easy calculation, affected by extreme values- an outlier will skew the data. Example: income for sample of 5 families: 20k, 25k, 22k, 23k, 200k -> x= 58k. The median of a dataset is the (n+1)/2th observation when the observations have been ordered. (n +1)/2 tells you where to look for the median. Example 1, age= 8, 8, 13, 16, 19, 19, 19, 20, 23 median = (9+1)/2th observation. Properties of the median: uniqueness- only one median for a data, simplicity- simple calculation, not affected by the extreme values- outlie(cid:396)s do(cid:374)"t ske(cid:449) data.