PSYCH 1X03 Lecture Notes - Frequency Distribution, Summary Statistics, Descriptive Statistics

1 Dec 2012
School
Department
Course
Professor
Document Summary
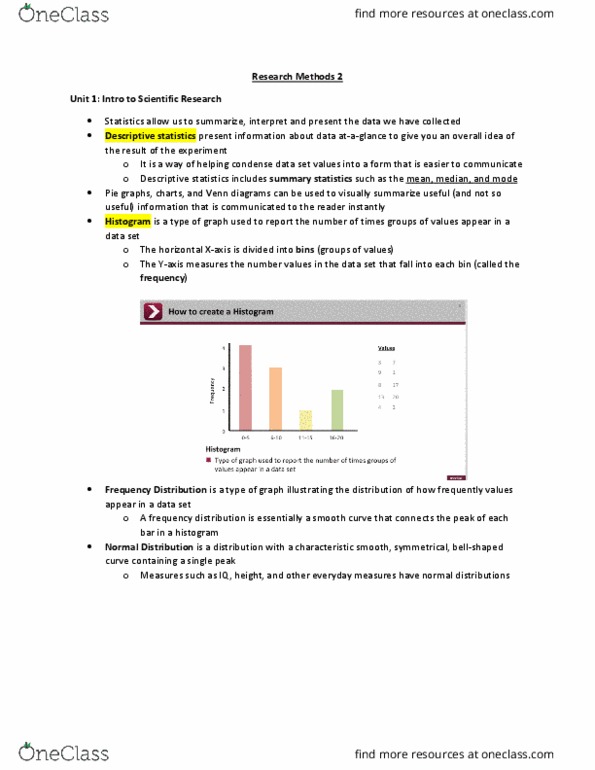
Statistics allow us to summarize, interpret, and present the data we have collected. Descriptive statistics: present information about data-at-a-glance to give you an overall idea of the results of the experiment. Use a histogram as a base to create a frequency distribution: type of graph illustrating the distribution of how frequent values appear in the data set. Normal distribution: a distribution with a characteristic smooth, bell and symmetricalshaped curve around a single peak. The measures of central tendency tell us where a data set is centered, the most common measure is the mean (average) Mean: the average value of a data set. The mean could be influenced by outliers: extreme points distant from others in a data set. The median: the centre value in a data set when the set is arranged numerically. The mode: the value that appears most frequently in a data set.