QMS 102 Lecture Notes - Lecture 2: Bar Chart, Histogram, Frequency Distribution

2 Nov 2017
School
Department
Course
Professor
Document Summary
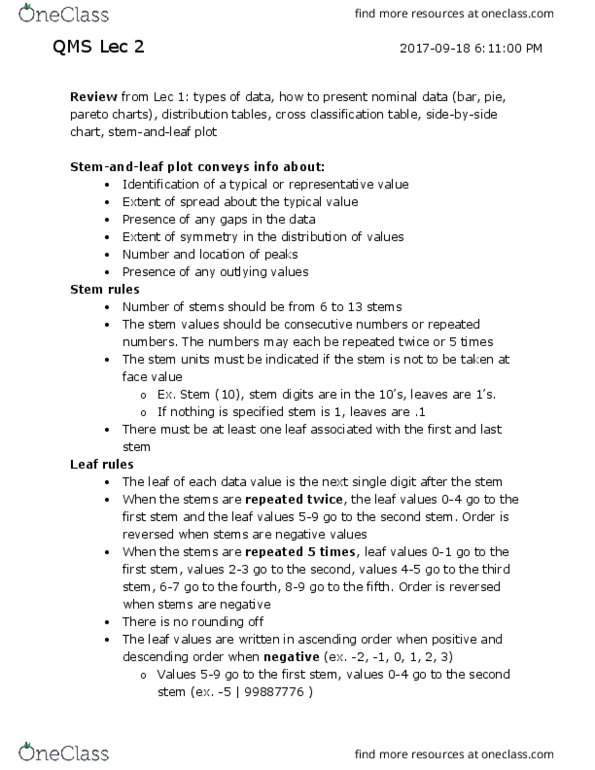
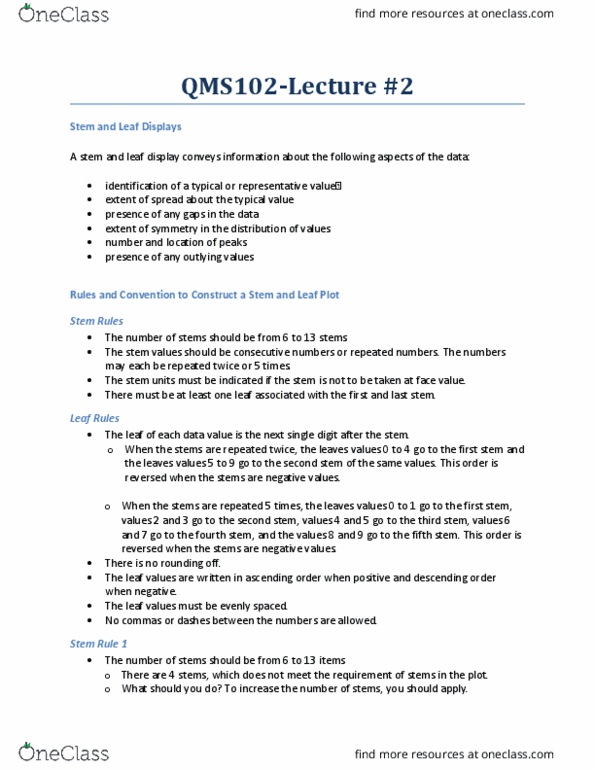
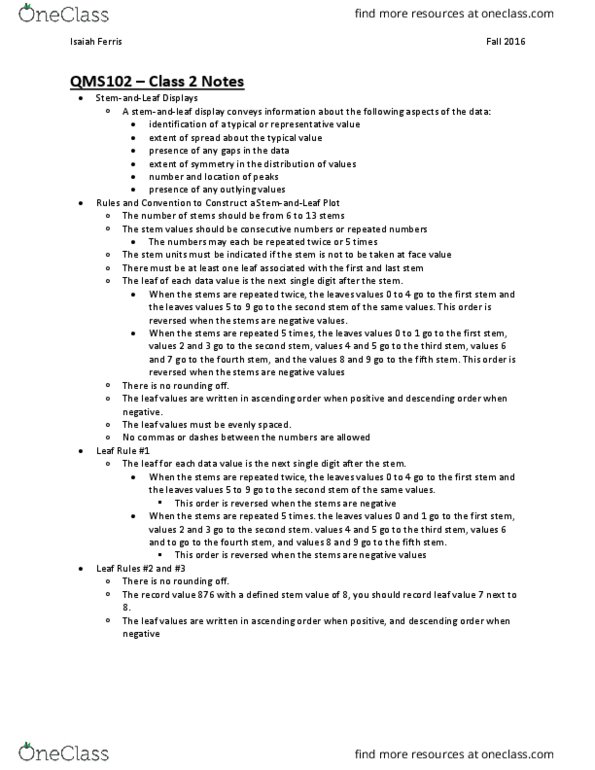
One leaf must be associated with the first & last stem; in between it doesn"t matter. Leaf of each data value is the next single digit after the stem. On 2 time repeats, the leaves valued 0-4 is on the first stem, 5-9 on the second stem. On 5 time repeats, leaves valued are broken apart with 2 digit values (0,1 first stem, 2,3 second stem) Orders are reversed for all situations when the stem has a negative value. A steam and leaf display conveys information about the following aspects of data: identification of a typical or representative value. Extent of spread about the typical value. Presence of any gaps in the data. Extent of symmetry in the distribution of values. Stem values should be consecutive numbers/repeated numbers. Numbers may be repeated 2 or 5 times. Stem units must be indicated if the steam is not to be taken at face value (10, 100, 1000)