QMS 102 Lecture Notes - Lecture 1: Pie Chart, Level Of Measurement, Pareto Chart

21 Feb 2016
School
Department
Course
Professor
Document Summary
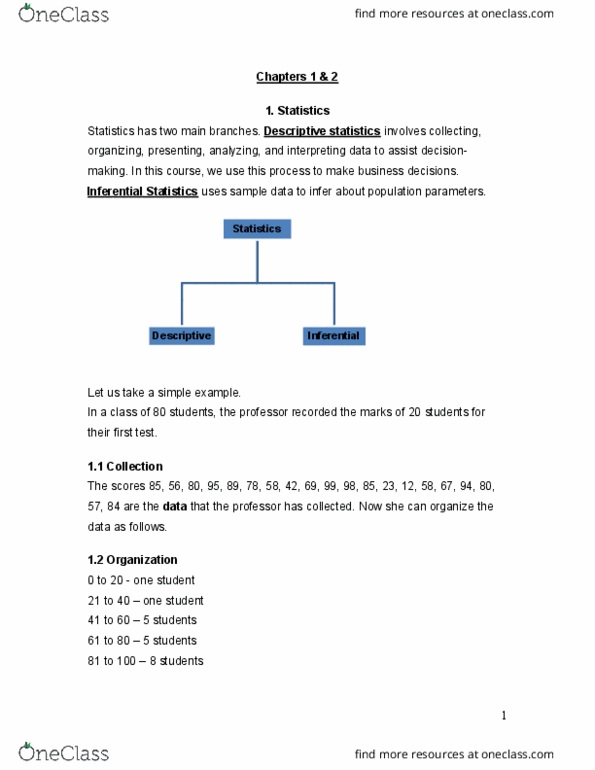
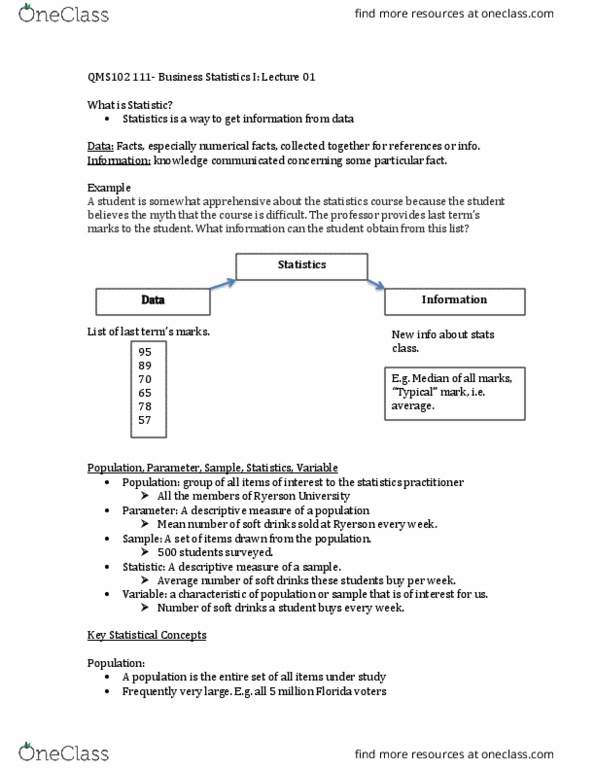
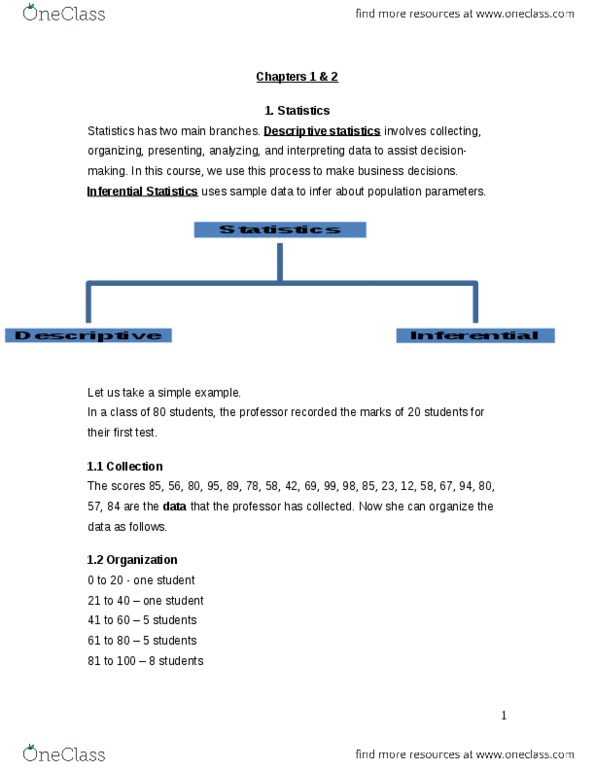
Descriptive statistics involves collecting, organizing, presenting, analyzing, and interpreting data to assist decision- making. In this course, we use this process to make business decisions. inferential statistics uses sample data to infer about population parameters. In a class of 80 students, the professor recorded the marks of20 studentsfor their first test. The scores 85, 56, 80, 95, 89, 78, 58, 42, 69, 99, 98, 85, 23, 12, 58, 67, 94, 80, 57, 84 are the data that the professor has collected. now she can organize the data as follows. One way of presenting data is by using a table. Constructing a percentage column is a simple way of analyzing the data although it is not a statistical method. Forty percent of student marks were in the 81 - 100 range. Sixty-five percent of the students received at least 61 marks. In the above example, the data are numerical.