ECON 201 Lecture Notes - Lecture 2: Scientific Method

29 Sep 2016
School
Department
Course
Professor
Document Summary
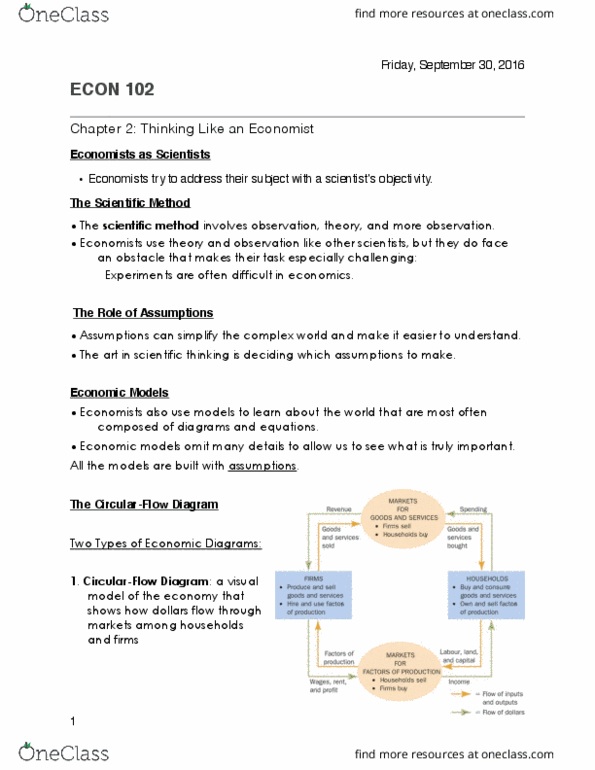
There are two uses for graphs in economics: Graphs are a visual way to express ideas that might not be as clear if they were expressed with equations or words. Graphs provide a way of finding out how variables are related to the world when analyzing economic data. Economists try to address their subject with a scientist"s objectivity. Have a theory, look at what happens in the real world, see if what we see actually matches what the theory tells us. The scientific method involves observation, theory, and more observation. Economists use theory and observation like other scientists, but they do face an obstacle that makes their task especially challenging: There are no constants in economics, because that"s impossible to predict in real life. Assumptions can simplify the complex world and make it easier to understand. The art in scientific thinking is deciding which assumptions to make.