BIOL 2060 Lecture Notes - Lecture 10: Rate Function, Logistic Function, Fisheries Management

Document Summary
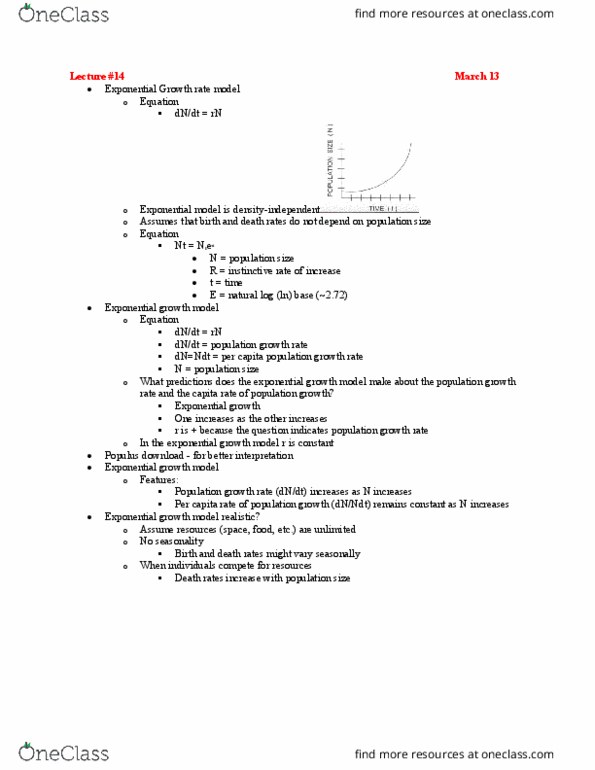
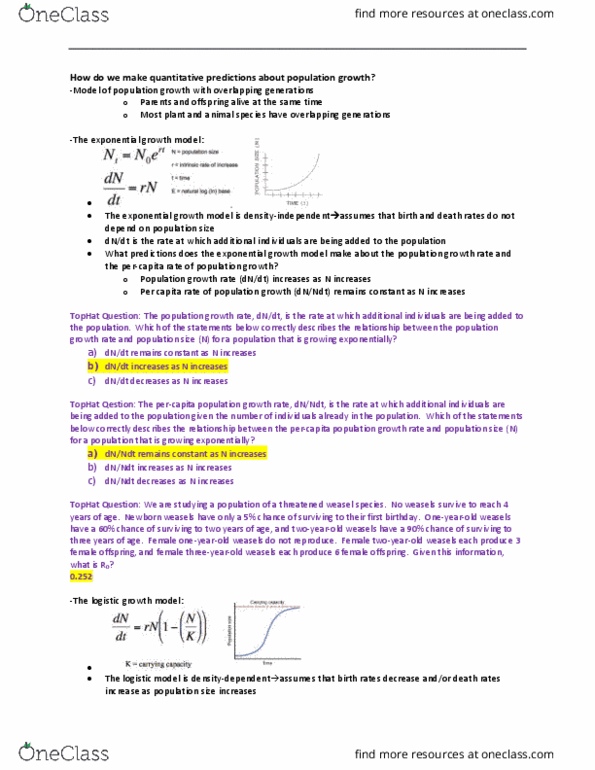
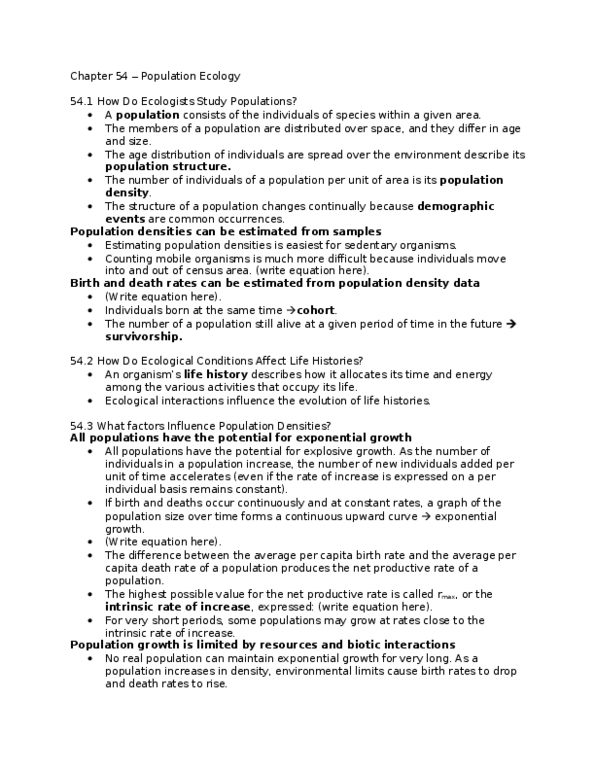
As resources are depleted, population growth rate slows & eventually stops. Population growth curve looks more like a sigmoid (s-shaped) curve (logistic growth) Carrying capacity (k) is the number of individuals of a population that the environment can support. Finite amount of resources can only support a finite number of individuals. (population size vs. time) (growth rate vs. population size) On exams don"t confuse the 2 graphs. What is the mechanism? (what is actually happening in nature?) As n increases the per capita birthrates (b) decreases & the per capita death rate (d) increases. Linear birth rate function: b = b0 an. B0 (intercept) = birth rate under ideal conditions (unlimited growth) A (slope) = decreasing rate of change. Linear death rate function: d = d0 + cn. D0 (intercept) = death rate under ideal conditions. C (slope) = increasing rate of change. No need to reproduce this example **