GEOG 2110 Lecture Notes - Lecture 3: Solar Irradiance, Pleistocene

9 Apr 2019
School
Department
Course
Professor

Document Summary
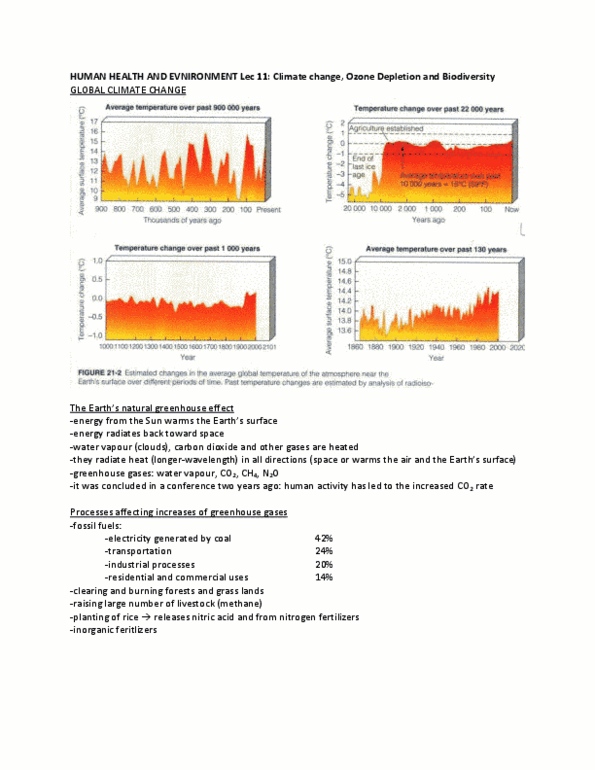
Hanna"s sea temp -- insolation climate varibility graph. I: looking at your graph of solar insolation and north atlantic sst for the last 700. The pattern of solar insolation seems to follow sea temperature quite consistently. 500, 000 years, fluctuation in sun strength seems to coincide with sea temperature in which stronger insolation result in higher a sst. Although variability is present in both lines of data, there seems to be periods of lag where insolation would be high and sst would be low. These coincide with past glacial periods with the pleistocene era, when the. Earth was beginning to cool: back in excel, change the x-axis limits so that you are now looking at the last 2 million years. You should see that there are times when insolation was very high (i count about. 12 points in time when it was above 475 wattchamacallits). The sst at high points of insolation ended up being lower or decreasing in temperature.