PSYC 2040 Lecture Notes - Lecture 7: Statistical Hypothesis Testing, Lincoln Near-Earth Asteroid Research

23 Mar 2016
School
Department
Course
Professor
Document Summary
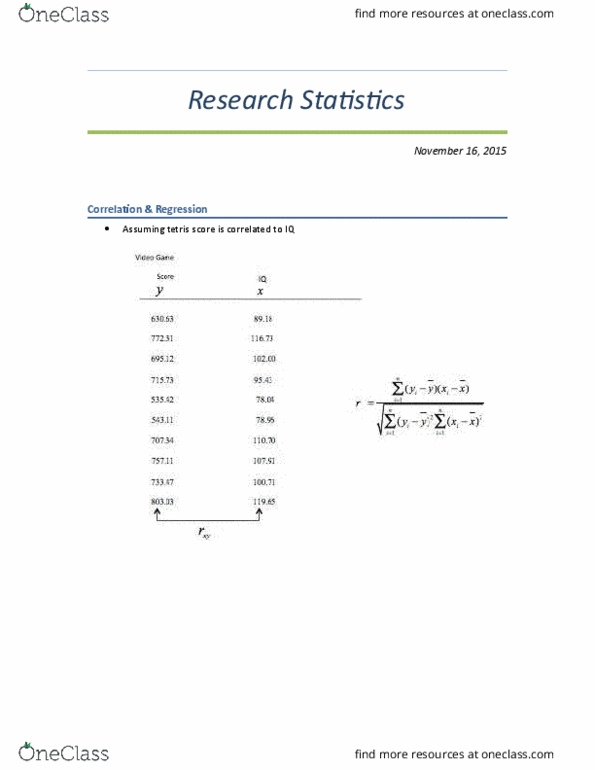
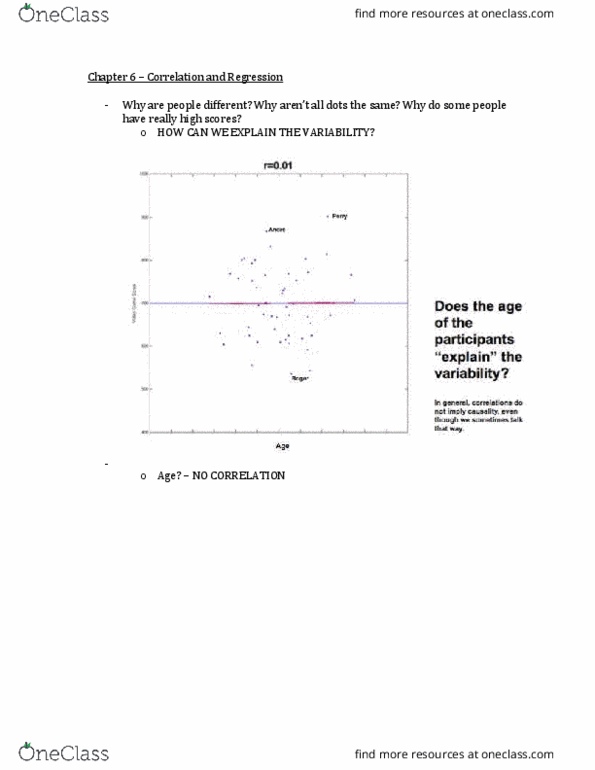
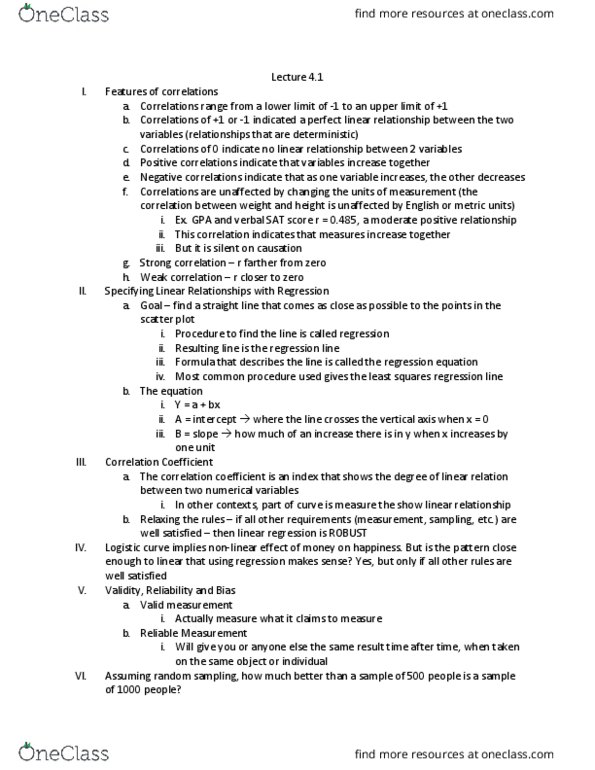
Correlaion is an index of how closely points are to the best it line: usually 0. 30 in psychology. Regression is the process we use to generate the equaion that describes the best it line. Indicates the extent to which the data it a linear (straight) regression line. Correlaions can be compared across diferent variables and contexts: that is, a correlaion between weight and height (ex. r =. 6) can be considered larger than the correlaion between grades and show size (ex. r= . 03) Low correlaion doesn"t necessarily imply no relaion, but that the data does not it a straight line. Imagine calculaing the correlaion between weight and height using everyone in canada o. Now imagine you took a random sample of 100 canadians: r = sample-level correlaion. We use signiicance tesing (with the data in your sample) to determine if the correlaion in the populaion is zero or not.