PSYC 3250 Lecture Notes - Lecture 10: Standard Deviation, Internal Consistency, Standard Error

22 Mar 2016
School
Department
Course
Professor
Document Summary
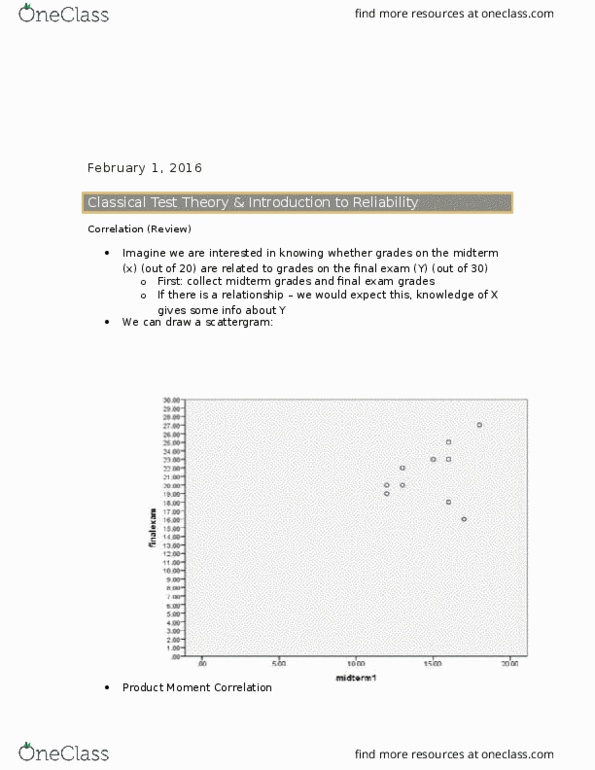
Imagine we are interested in knowing whether grades on the midterm (x) (out of 20) are related to grades on the inal exam (y) (out of 30 points) We would begin by collecing the midterm grades and inal exam grades for a group of people (ex. last year"s class) If there is a relaion between x and y, this means that a knowledge of x gives us some informaion about y. First of all, we can draw a scatergram, which plots the 2 variables as coordinates. The staisic is denoted as rxy , and is calculated over n pairs of observaions. With x and y as z scores (zx and zy, mean = 0, sd = 1) The average cross product of z scores: 2 +/- values make a posiive correlaion, 1 + & 1 values make a negaive correlaion.