SOAN 2120 Lecture Notes - Lecture 8: Statistical Parameter, Central Limit Theorem, Sampling Error

15 Oct 2017
School
Department
Course
Professor
Document Summary
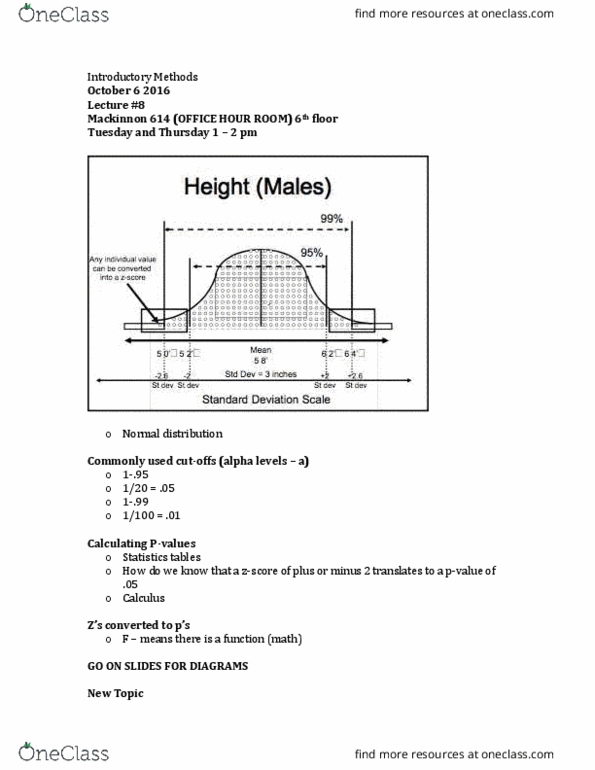
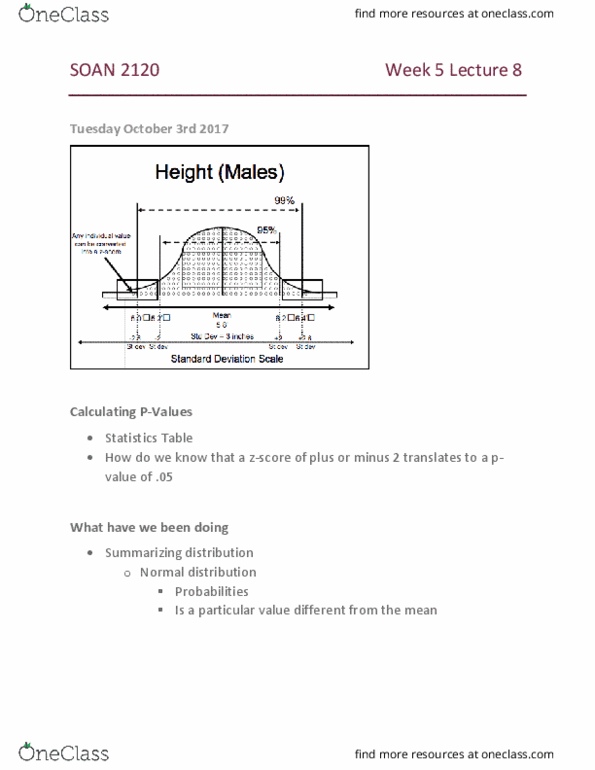
Z scores tell us how many sd the observation is from the mean. Calculating p-values: statistics tables, how do we know that a z-score of plus or minus 2 translates to a p-value of . 05, calculus. What have we been doing: summarizing distributions. New topic: statistical inference, using sample information to estimate population values, normal distribution, just as variables have distributions, sample statistics have distributions as well. If we infer" something it means we draw a conclusion. Statistical inference is a tool for drawing conclusions from data that are a random sample: probability allows us to take chance variation into account, collecting good data (no substitute) If we do not use random samples, however, our conclusions are open to challenge. The distribution of a variable using data from our sample (distribution of height, study time, grades: population distribution. The distribution of the variable in the population (we typically do not see: sampling distribution**** most important *****