SOAN 3120 Lecture Notes - Lecture 3: Standard Score, Standard Deviation, Statistical Inference

26 Oct 2016
School
Department
Course
Professor
Document Summary
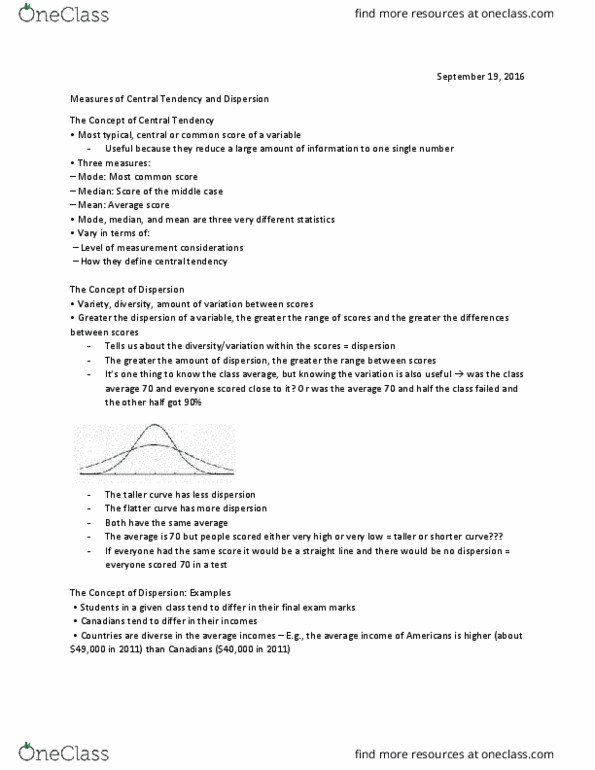
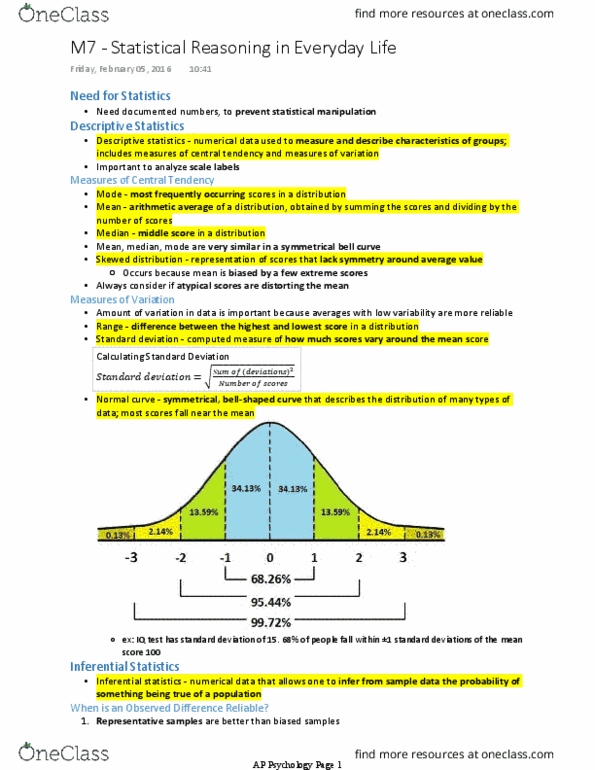
The normal curve: z scores and estimating probabilities. I(cid:374) realit(cid:455), (cid:373)ost distri(cid:271)utio(cid:374)s (cid:449)o(cid:374)"t (cid:272)o(cid:374)for(cid:373) to the (cid:374)ormal curve exactly. Exam grades in large classes often end up closely approximating the normal curve, as do height and weight. The normal curve is based on the assumption of normality (normally distributed throughout a population or sample), most people are in the average. Theoretical normal curve: bell shaped, u(cid:374)i(cid:373)odal it has a single mode (only has one peak, (cid:455)(cid:373)(cid:373)etri(cid:272)al distri(cid:271)utio(cid:374, u(cid:374)ske(cid:449)ed, mode = media(cid:374) = mea(cid:374) Theoretical normal curve: specific areas: dista(cid:374)(cid:272)es o(cid:374) horizo(cid:374)tal a(cid:454)is al(cid:449)a(cid:455)s represe(cid:374)t the sa(cid:373)e area. The number of people that are captured within plus or minus 1 standard deviation of the mean will always be 68. 26% Tells you that most people are near the average, extremes are really rare. Theoretical normal curve: example iq scores for a sample of 1,000 men where = 100 and s = 20.