STAT 2040 Lecture Notes - Lecture 5: Weibull Distribution, Probability Distribution, F-Distribution

27 Feb 2018
School
Department
Course
Professor
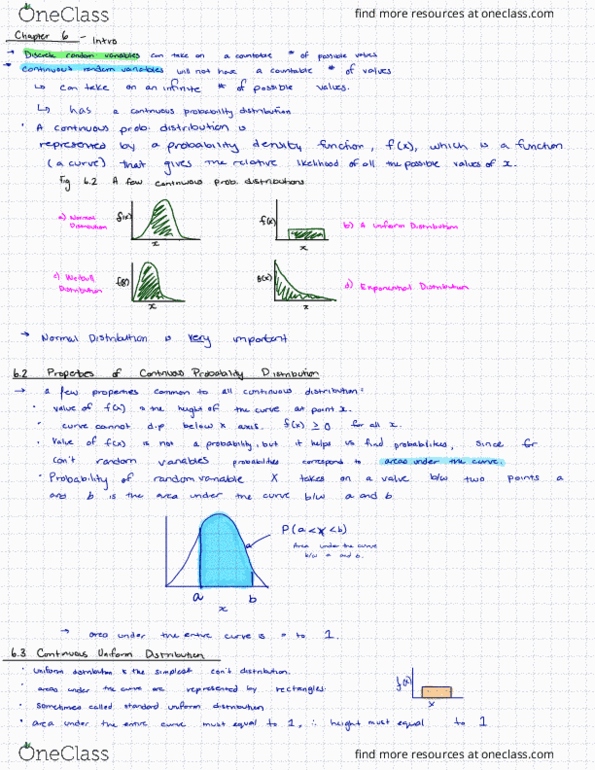
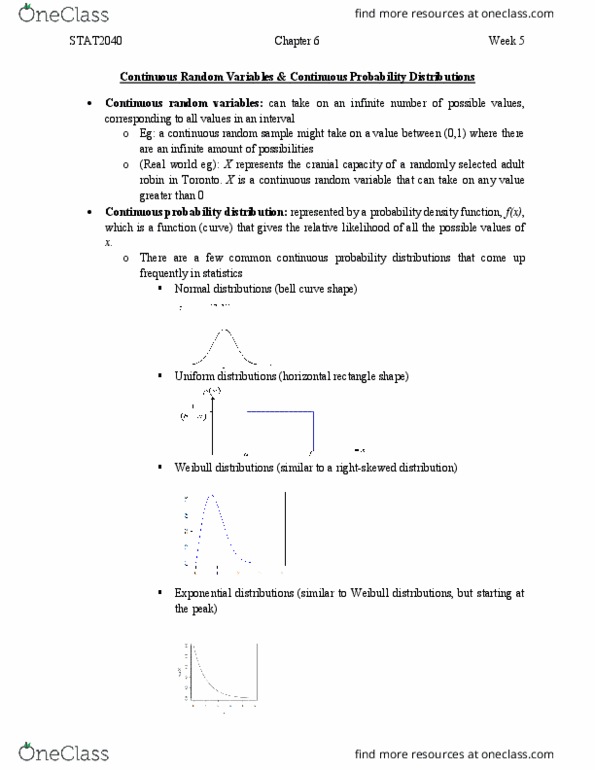
Document Summary
In a normal quartile-quartile plot the ordered data values from the sample are plotted against the appropriate quartiles of the standard normal distribution. If the sample data is approximately normally distributed, this technique will result in points that lie on an approximately straight line. If the random variable z has the standard normal distribution, the z2 has the x2 distribution with one degree of freedom: also, the sum of squared independent standard normal random variables has a. For k (cid:3410) 2, the mode of the x2 distribution occurs at. It has a similar appearance to the standard normal distribution, but with heavier tails and a lower peak. If v1 v2 , then the median will not be exactly 1, but it is often in the. If v1 = v2 , then the median is exactly 1 neighborhood of 1: areas under the curve and percentiles can be found using software or an f table, 6. 7: chapter summary.