ECON101 Lecture 6: Chapter 8


Get access


Related Documents
Related Questions
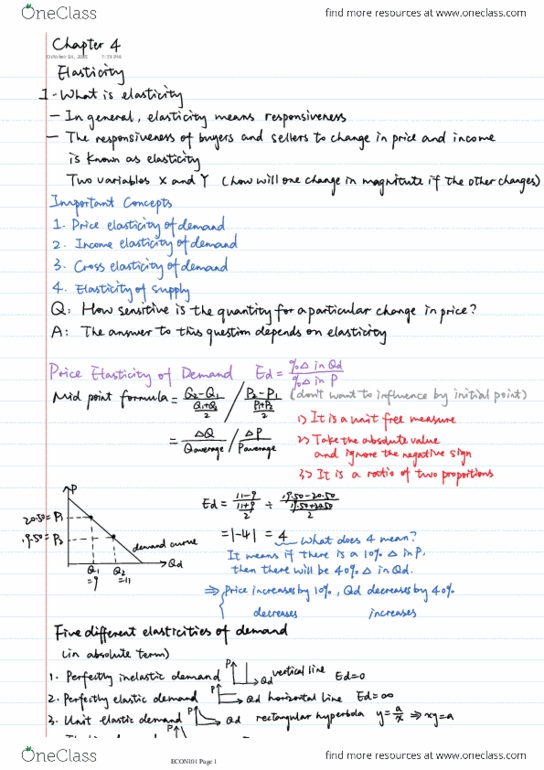
Find the utility-maximizationcombination of movies and books with the following data.
Price of movie = $4; Price of Book=$2; Income=$20
Quantity | Marginal Utility | |
Movies | Books | |
1 | 54 | 24 |
2 | 48 | 18 |
3 | 42 | 14 |
4 | 36 | 10 |
5 | 33 | 6 |
6 | 27 | 4 |
7 | 18 | 2 |

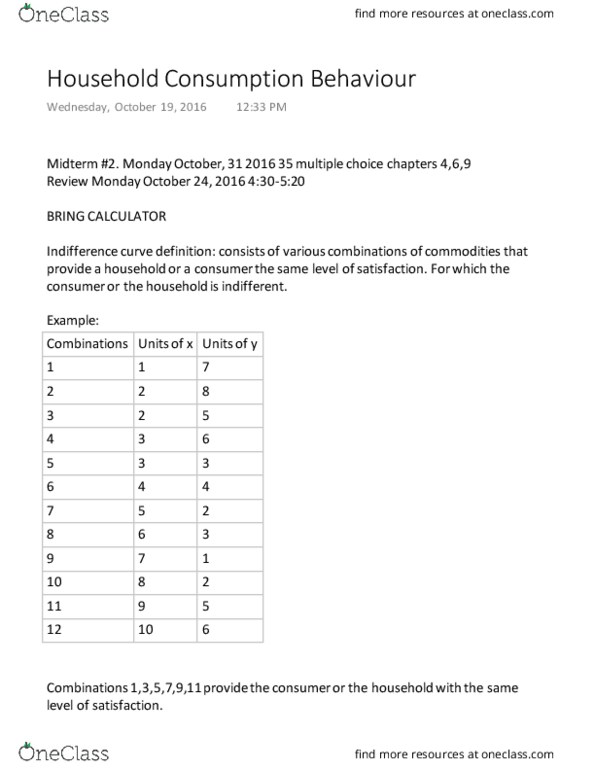
Find the utility-maximization combination of movies and books with the following data.
Price of movie = $3; Price of Book=$2; Income=$22
|
Quantity |
Marginal Utility |
|
|
Movies |
Books |
|
|
1 |
54 |
20 |
|
2 |
48 |
18 |
|
3 |
42 |
14 |
|
4 |
36 |
10 |
|
5 |
33 |
6 |
|
6 |
27 |
4 |
|
7 |
18 |
2 |

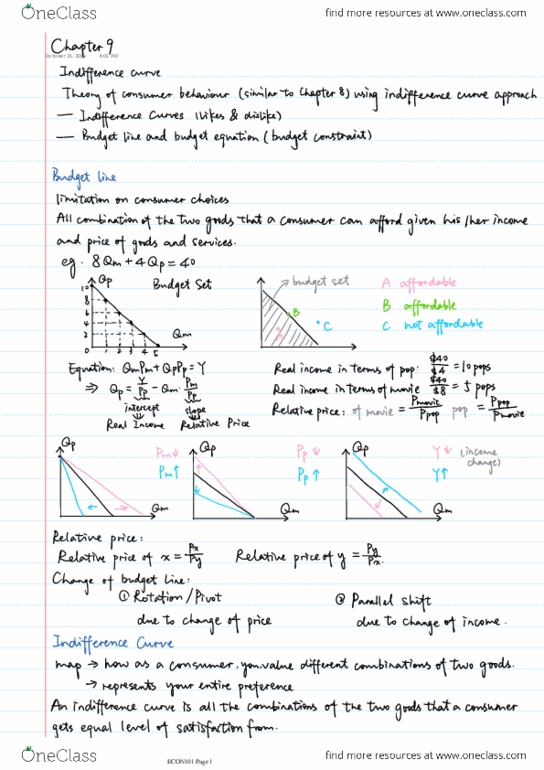
How can you calculate NAIRU for Q3 and Q4. I know Q3 is between July-September while Q4 is between October-December.
In this table, I found
|
Year |
Real GDP |
Unemployment |
CPI |
Real GDPpotential |
NAIRU |
|
2015 |
$16,414.0 billion |
5.167% |
238.305 |
$16,746 billion |
|
|
2015 |
$16,470.6 billion |
5.% |
237.233 |
$16,809 billion |
-----------------------------------------------------------------------------------------------------------
|
Year |
Unemployment |
CPI |
NAIRU |
|
July |
5.3% |
238.654 |
|
|
August |
5.1% |
238.316 |
|
|
September |
5.1% |
237.945 |
|
|
October |
5% |
237.838 |
|
|
November |
5% |
237.336 |
|
|
December |
5% |
236.525 |
I found the data online and got the Real GDP and GDP potential quarterly, but for Unemployment and CPI, I used the averages of the number from the table (months). How can I solve for NAIRU?
