ECON 202 Lecture 12: Chap12-Spring2016
42 views20 pages

7 Jul 2016
School
Department
Course
Professor
Document Summary
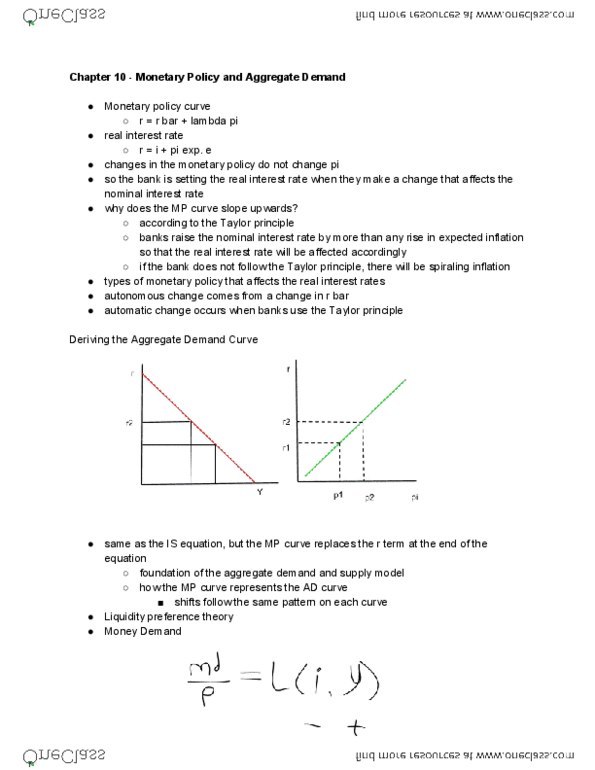
Chapter 12: the aggregate demand and supply model. Recap of the aggregate demand and supply curves: the aggregate demand curve. It shows the relationship between the inflation rate and the level of aggregate output when the goods market is in equilibrium. It slopes downward because a rise in inflation leads the monetary policy authorities to raise real interest rates to keep inflation from getting out of control, which lowers aggregate demand and thus the equilibrium level of aggregate output. Factors that shift the ad curve: government purchases, autonomous monetary policy, I , c , nx y (ad curve shifts to the. Y (ad curve shifts to the. Taxes, c y (ad curve shifts to the : autonomous net exports, (cid:1850) (cid:1850) y (ad curve shifts to the. Y (ad curve shifts to the: autonomous consumption expenditure, autonomous investment, short- and long-run aggregate supply curves. Wages and prices are sticky in the short run, but fully flexible in the long run.
Get access
Grade+20% off
$8 USD/m$10 USD/m
Billed $96 USD annually

Homework Help
Study Guides
Textbook Solutions
Class Notes
Textbook Notes
Booster Class
40 Verified Answers
Class+
$8 USD/m
Billed $96 USD annually

Homework Help
Study Guides
Textbook Solutions
Class Notes
Textbook Notes
Booster Class
30 Verified Answers
Related Documents

Related Questions

| a) | In the AD-AS model, stagflation does not persist, because the working of the self-correcting mechanism of the economy _____ the level of output and _____ the price level until the economy eventually returns to a long-run equilibrium state, where actual output _____ potential output.
|
| b) | The LRAS curve is drawn as a vertical line at potential output (Y*) to indicate that
|
| c) | Stagflation arises in the context of the AD-AS model when some external factor causes
|
| d) | If the SRAS curve is positively sloped, then a decrease in the demand for Canadian-made goods in Europe will lead to _____ in the price level, in the short run.
|
| e) | Which of the following will shift the aggregate demand curve to the right?
|
| f) | Suppose a stock market crash decreases the stock of household wealth and therefore causes autonomous consumption to fall. Which of the following is the likely result?
|
| g) | An economy is characterized by the AD equation P = 200 ? 0.02Y, SRAS equation P = 100 and LRAS equation Y* = 5000. In the absence of any change in policy or exogenous shocks, this economy will achieve a long-run price level of
|
| h) | The AD-AS model depicts a self-correcting economy. This means that the price level in the model adjusts automatically in response to a(n) _____ gap, so as to eliminate the _____ gap in the long run, without requiring any help from government policies.
|
| i) | The aggregate demand curve shows
|
| j) | Consider an economy initially at long-run equilibrium with output (Y) equal to potential output (Y*). If the SRAS is positively sloped, then a shift to the right of the AD curve will lead to _____ in the price level, in the short run. In the long run, the SRAS curve will shift to the _____ and the equilibrium will be at __________.
|
