KIN232 Lecture Notes - Lecture 1: Parametric Statistics, Nonparametric Statistics, Descriptive Statistics


Kin 232 Midterm
Lecture One – Descriptive Statistics
Descriptive Statistics
• What are descriptive statistics?
o These are tools used to organize and illustrate data.
o They include, but are not limited to tables, graphs, measures of central tendency,
measures of variability, etc.
• Population
o A group of people who share similar characteristics that we are interested in studying.
o It’s a group of people that you’re interested in studying.
o Target population: the ideal population that you want to study
o Accessible population: the people that you can actually gain access to
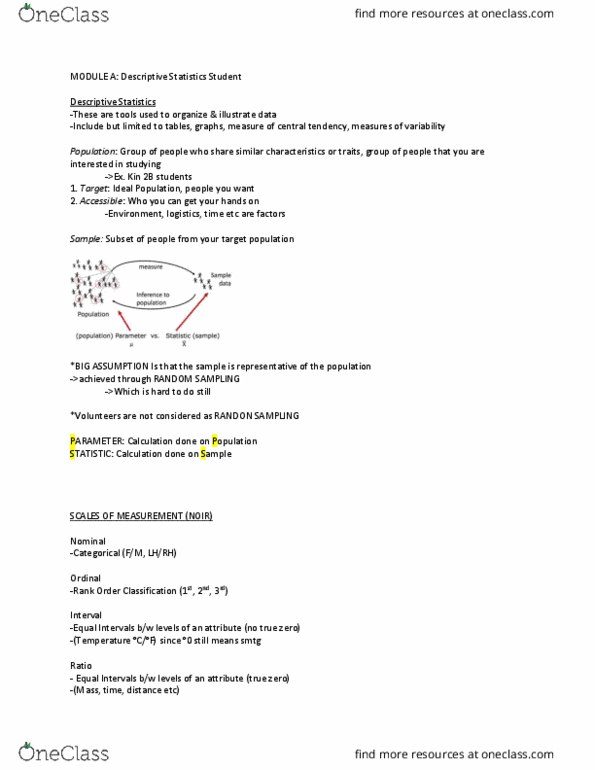
• Sample
o A subset of people from your target population
• **Big assumption is that the sample is representative of the population. This is achieved
through random sampling** → we want to be able to make inferences
• Random sampling is hard to do → volunteers are not considered to be random sampling
• Statistics are related to a sample
• Parameters are related to populations
Scales of Measurement
• Non-parametric statistics (qualitative)
o Nominal – categorical, frequency
▪ e.g. male/female, left-handed/right-handed, etc.
o Ordinal – rank-order classification, comparison
▪ E.g. 100 m race 1st, 2nd, 3rd, etc
• Parametric statistics (quantitative)
o Interval - equal intervals between levels of an attribute - no true zero
▪ E.g temperature (C or F) at zero degrees C
▪ A temp of 0 doesn’t mean that temperature is absent
o Ratio - equal intervals between levels of an attribute - true zero
▪ E.g. distance, time, mass
▪ Can’t have a negative number

• Scores
o What is a score?
▪ The value of a variable that you have measured e.g. HR, time
▪ Represented by X
▪ Typically refers to an interval or ratio data
▪ This language is mainly applied to interval or ratio data
▪ If you are male, that doesn’t really represent a score, nor if you are 1st in a race
Data Sets or Distribution
• A data set or distribution is a collection of scores – typically arranged in a series of columns
and rows.
Subject
M/F
Height
(cm)
Weight
(kg)
Age
(years)
1
f
168
85
19.91
2
f
170
77
20.08
3
F
157
53
20.16
4
F
170
57
19.58
5
F
168
62
19.99
6
M
173
65
20.41
7
M
165
61
19.91
8
M
180
82
20.33
9
M
185
89
20.33
10
M
168
67
21.3
• Data is not truly representative of the population because we did not have a random sample
• Why are volunteers not a random sample?
o E.g. a smoking cessation program
▪ Those who volunteer are likely intrinsically motivated, which may not be
indicative of the general pop.
▪ Things like random assignment to control and intervention groups helps to control
for this
Measures of Central Tendency – Mode
• Mode = the number (value) that occurs most frequently
Height (cm)
Height (cm)
168
157
170
165
157
168
170
168
168
168
173
170
165
170
Document Summary
Scales of measurement: non-parametric statistics (qualitative, nominal categorical, frequency, e. g. male/female, left-handed/right-handed, etc, ordinal rank-order classification, comparison, e. g. If you are male, that doesn"t really represent a score, nor if you are 1st in a race. Data sets or distribution: a data set or distribution is a collection of scores typically arranged in a series of columns and rows. 67: e. g. a smoking cessation program, those who volunteer are likely intrinsically motivated, which may not be indicative of the general pop, things like random assignment to control and intervention groups helps to control for this. Measures of central tendency mode: mode = the number (value) that occurs most frequently. Md = 168 cm: advantages, somewhat easy to do, not influenced by extreme scores, disadvantages, does not consider the magnitude of each score. Measures of variability standard deviation: standard deviation (s) is the square root of variance, = 59. 82 cm2.