COMM 291 Lecture Notes - Lecture 4: Scatter Plot, Box Plot, Interquartile Range


16
COMM 291 Full Course Notes
Verified Note
16 documents
Document Summary
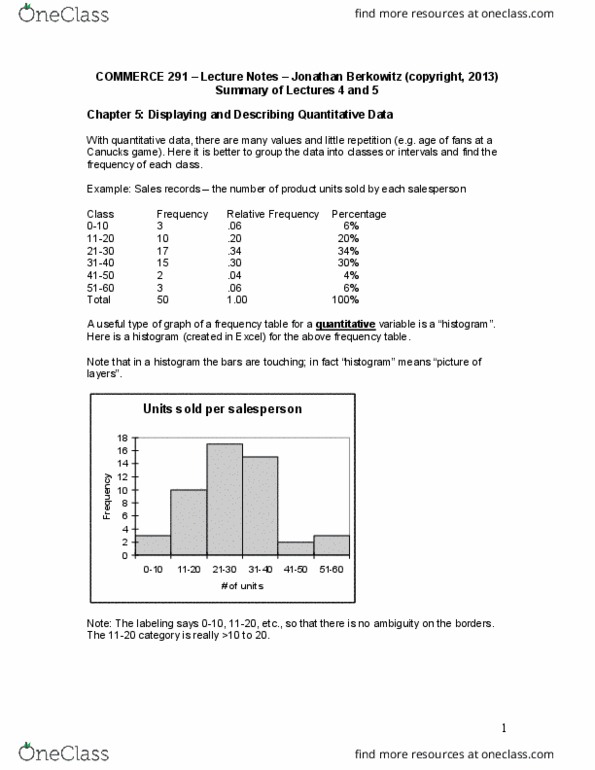
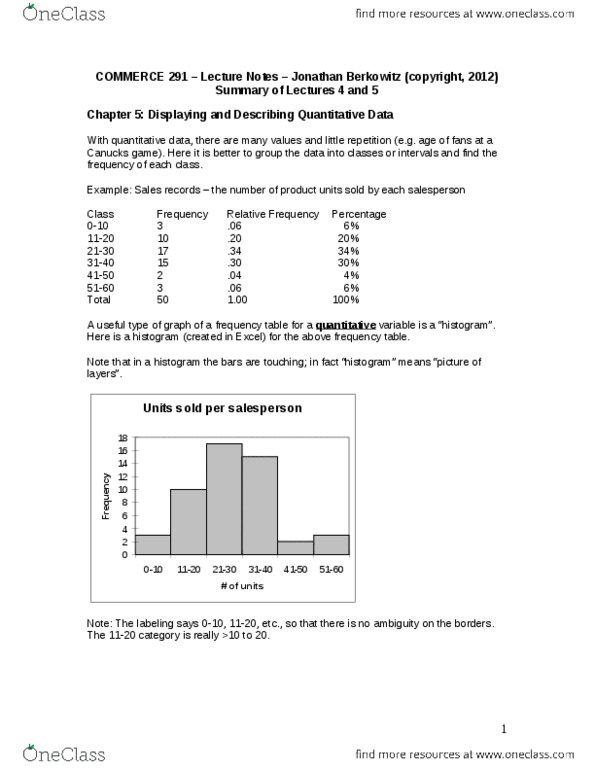
Chapter 5: displaying and describing quantitative data continued. Time series plots: one type of very useful graph not previously discussed is a time plot where the values are plotted in time order, with time on the horizontal axis. An example is the familiar plot of sales records by month, or stock prices by day: time series plots show change over time as upward or downward trends. They can also show variability with change in size of fluctuations over time. For symmetric distributions, the mean equals the median. For asymmetric or skewed distributions, the mean and the median are not equal. If the distribution has a long right-hand tail (i. e. skewed right) the mean is greater than the median. If the distribution has a long left-hand tail (i. e. skewed left), the mean is less than the median. The median is a more robust measure than the mean; that is, it is not highly affected by the presence of outliers.