ECON 325 Lecture Notes - Lecture 9: Nipple, Summary Statistics, Cumulative Distribution Function

Get access


Related Documents
Related Questions
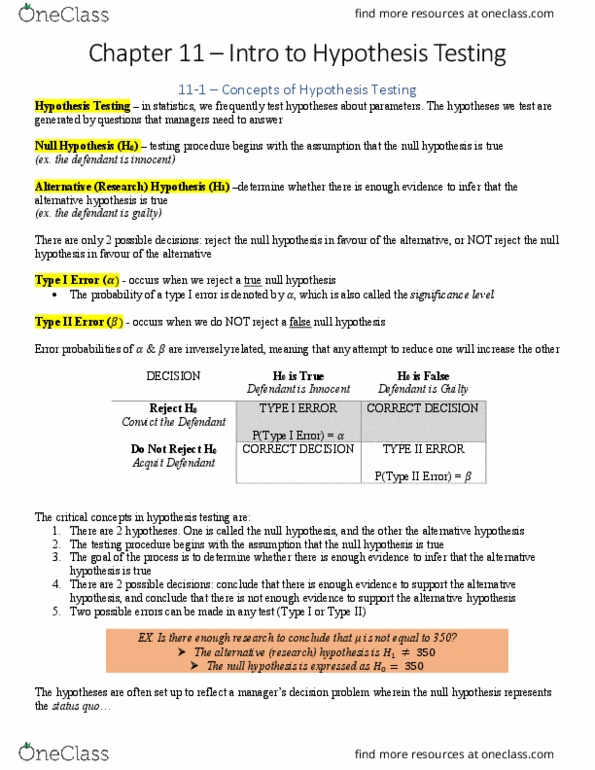
| 1 | Which of the following statements about Type I and Type II errors is correct | ||||||||
| a | Type I: Reject a true alternative hypothesis. Type II: Do not reject a false alternative. | ||||||||
| b | Type I: Reject a true null hypothesis. Type II: Do not reject a false null hypothesis. | ||||||||
| c | Type I: Reject a false null hypothesis. Type II: Reject a true null hypothesis. | ||||||||
| d | Type I: Do not reject a false null hypothesis. Type II: Reject a true null hypothesis. | ||||||||
| 2 | You are reading a report that contains a hypothesis test you are interested in. The writer of the report writes that the p-value for the test you are interested in is 0.0749, but does not tell you the value of the test statistic. From this information you can: | ||||||||
| a | Not reject the hypothesis at a Probability of Type I error = .05, but reject the hypothesis at a Probability of Type I error = 0.10 | ||||||||
| b | Reject the hypothesis at a Probability of Type I error = .05, and reject at a Probability of Type I error = 0.10 | ||||||||
| c | Not reject the hypothesis at a Probability of Type I error = 0.05, and not reject at a Probability of Type I error = 0.10 | ||||||||
| d | Reject the hypothesis at a Probability of Type I error = .05, but not reject at a Probability of Type I error = 0.10 | ||||||||
| 3 | The random sample below is obtained to test the following hypothesis about the population mean. | ||||||||
| H?: ? ? | 1500 | ||||||||
| H?: ? > | 1500 | ||||||||
| 620 | 1711 | 366 | 2528 | 2678 | 1661 | 442 | 725 | 1938 | |
| 409 | 330 | 2480 | 542 | 369 | 2124 | 549 | 2074 | 1665 | |
| 1873 | 873 | 2143 | 2061 | 1177 | 2509 | 1264 | 2397 | 1523 | |
| 1837 | 1958 | 1041 | 1639 | 2199 | 2232 | 387 | 2270 | 2136 | |
| 1111 | 1883 | 2612 | 2230 | 1597 | 1726 | 694 | 1990 | 1354 | |
| 2090 | 909 | 2128 | 1608 | 747 | 1121 | 2220 | 2390 | 2347 | |
| 1041 | 316 | 655 | 632 | 2064 | 1901 | 532 | 552 | 846 | |
| 2704 | 1410 | 2165 | 1065 | 937 | 1452 | 2539 | 410 | 656 | |
| 1169 | 527 | 809 | 2364 | 2350 | 2210 | 1459 | 2391 | 856 | |
| 2711 | 1985 | 2382 | 2289 | 1927 | 518 | 2177 | 437 | 1151 | |
| 2018 | 1580 | 607 | 2715 | 2188 | 1691 | 1394 | 2610 | 1186 | |
| 695 | 2428 | 2246 | 858 | 2036 | 1681 | 2449 | 1578 | 1971 | |
| 1846 | 1729 | 2389 | 1737 | 1913 | 1863 | 2072 | 2593 | 2287 | |
| 2220 | 2230 | 551 | 458 | 2626 | 2731 | 488 | 2551 | 1736 | |
| 1373 | 307 | 1803 | 2647 | 2679 | 1508 | 1468 | 1443 | 516 | |
| 1002 | 2116 | 2616 | 817 | 2522 | 460 | 1879 | 1999 | 1837 | |
| The level of significance of the test is ? = 0.05. Compute the relevant test statistic. | |||||||||
| This is a(n) _______ (two-tail, upper-tail, lower-tail) test. The test statistic is TS = _______. | |||||||||
| a | Two-tail test | TS = | 1.81 | ||||||
| Do not reject H?: ? ? 1500. Conclude that the population mean is not greater than 1500. | |||||||||
| b | Upper tail test. | TS = | 1.52 | ||||||
| Do not reject H?: ? ? 1500. Conclude that the population mean is not greater than 1500. | |||||||||
| c | Upper tail test. | TS = | 1.81 | ||||||
| Reject H?: ? ? 1500. Conclude that the population mean is greater than 1500. | |||||||||
| d | Lower tail test. | TS = | 1.98 | ||||||
| Do not reject H?: ? ? 1500. Conclude that the population mean is no greater than 1500. | |||||||||
| 4 | Consider the following hypothesis test. | ||||||||
| H?: ? ? | 30 | ||||||||
| H?: ? > | 30 | ||||||||
| A random sample of n = 15 yielded the following observations | |||||||||
| 51 | 38 | 26 | 16 | 28 | |||||
| 57 | 20 | 33 | 35 | 23 | |||||
| 21 | 47 | 56 | 54 | 36 | |||||
| Use ? = | 0.05 | ||||||||
| TS = ______ | CV = ______ | State the decision rule. | |||||||
| a | 1.68 | 1.761 | Do not reject H?. Conclude the mean is not greater than 30. | ||||||
| b | 1.68 | 1.64 | Reject H?. Conclude the mean is greater than 30. | ||||||
| c | 1.847 | 2.145 | Do not reject H?. Conclude the mean is not less than 30. | ||||||
| d | 1.847 | 1.761 | Reject H?. Conclude the mean is less than 30. | ||||||
| 5 | In a recent study, a major fast food restaurant had a mean service time of 165 seconds. The company embarks on a quality improvement effort to reduce the service time and has developed improvements to the service process. The new process will be tested in a sample of stores. The new process will be adopted in all of its stores, if it reduced mean service time by more than 45 seconds compared to the current mean service time. To perform the hypothesis test, the sample of 48 stores yields the following data (seconds). | ||||||||
| 90 | 96 | 133 | 108 | 136 | 110 | 119 | 138 | ||
| 129 | 98 | 101 | 92 | 135 | 124 | 115 | 90 | ||
| 132 | 125 | 110 | 124 | 126 | 138 | 94 | 130 | ||
| 108 | 96 | 140 | 135 | 102 | 114 | 109 | 137 | ||
| 138 | 104 | 108 | 134 | 92 | 107 | 96 | 119 | ||
| 105 | 111 | 96 | 136 | 126 | 116 | 98 | 131 | ||
| Use ? = | 0.05 | ||||||||
| |TS| = ______ | |CV| = ______ | ||||||||
| a | 1.548 | 1.678 | Do not reject H?. The mean service time is not reduced by more than 45 seconds. Do not adopt the new process. | ||||||
| b | 1.871 | 1.678 | Reject H?. The mean service time is reduced by more than 45 seconds. Adopt the new process. | ||||||
| c | 1.871 | 1.640 | Do not reject H?. The mean service time is not reduced by more than 45 seconds. Do not adopt the new process. | ||||||
| d | 1.548 | 1.640 | Reject H?. The mean service time is reduced by more than 45 seconds. Adopt the new process. | ||||||
Question 1
Which of the following approaches to understanding and predicting consumer behavior depends primarily on the knowledge and experience of a firm's employees and its suppliers?
| Test marketing and price experiments | ||
| Analysis of historical data. | ||
| Direct consumer surveys. | ||
| Expert opinion. |
Question 2
In which of the following situations would reliance on expert opinion as a basis for a managerial decision be most preferred?
| When the product being marketed is relatively new. | ||
| When the level of economic activity can have a significant effect on the demand for the firm's output. | ||
| When the product can be packaged with a variety of price and quality combinations. | ||
| When the business in question serves as a supplier of inputs to other businesses, especially in multi-product situations where other strategies may be prohibitively expensive. |
Question 3
The approach to analyzing consumer behavior that asks consumers to rank and choose among different product attributes to reveal their relative valuation of different characteristics is called:
| conjoint analysis. | ||
| contingent valuation. | ||
| the hedonic estimation technique. | ||
| a direct consumer survey. |
Question 4
All of the following are limitations of direct consumer surveys except:
| the possibility of response biases because survey respondents may not want to reveal their true preferences. | ||
| the possibility that the type of questions asked may unintentionally bias the respondent's answers. | ||
| the likelihood that respondents will deliberately and systematically mislead interviewers. | ||
| the possibility that consumers' responses may not reflect their actual behavior in the market place. |
Question 5
Which of the following approaches to understanding and predicting consumer behavior does not actually solicit any information from potential customers?
| Expert opinion. | ||
| Test marketing. | ||
| Analysis of historical data. | ||
| Conjoint analysis. |
Question 6
Data collected on a sample of individuals with different characteristics at a specific point in time are called:
| panel data. | ||
| cross-section data. | ||
| time series data. | ||
| none of the above. |
Question 7
Which of the following approaches to understanding and predicting consumer behavior provides the most insight into how consumers can be expected to respond in an actual market setting?
| Test marketing. | ||
| Conjoint analysis. | ||
| Expert opinion. | ||
| Analysis of historical data. |
Question 8
An approach to analyzing consumer behavior in which consumer reaction to different prices is analyzed in a laboratory situation or a test market is called:
| non-price experiments. | ||
| focus groups. | ||
| price experiments. | ||
| none of the above. |
Question 9
Data collected on the same observation unit at a number of points in time are called:
| panel data. | ||
| time series data. | ||
| cross-section data. | ||
| none of the above. |
Question 10
A measure of how much the coefficient would vary in regressions based on different samples is called:
| F-statistic. | ||
| standard error of the estimated coefficient. | ||
| t-statistic. | ||
| partial F-statistic. |
Question 11
The test statistic used to test the hypothesis of whether a regression coefficient is significantly different from zero, holding all other independent variables constant, is called a(n):
| t-test. | ||
| F-test. | ||
| multicollinearity test. | ||
| autocorrelation test. |
Question 12
Regression analysis that analyzes the relationship between one dependent variable and several independent variables is called:
| cluster analysis. | ||
| correlation analysis. | ||
| multiple regression analysis. | ||
| simple regression analysis. |
Question 13
The ratio of the regression coefficient to its standard error is called:
| F-statistic. | ||
| t-statistic. | ||
| coefficient of determination. | ||
| partial F-statistic. |
Question 14
The coefficient of determination will range between what values?
| -1 and +1 | ||
| 0 and 1 | ||
| -3 and +3 | ||
| none of the above |
Question 15
The range of values in which we can be confident that the true regression coefficient lies within a given degree of probability is called a:
| confidence interval. | ||
| logistic regression. | ||
| prediction interval. | ||
| none of the above. |
Question 16
The estimated regression equation is Y = 10 + 2.5X, if X =0 than the predicted value of Y is equal to
| 2.5 | ||
| 7.5 | ||
| 12.5 | ||
| 10 |
