SCMA*2040 Lecture Notes - Lecture 11: Randomness, Confidence Interval, Squared Deviations From The Mean


Week 10: Stats Intro
Standard Deviation
-List all scores
-Locate the mean of the scores
-Generate a corresponding list indicating deviation from the mean
-Generate a corresponding list indicating the square of each deviation
-Locate the mean of the squared deviations
-Generate the square root of the (squared deviations mean)
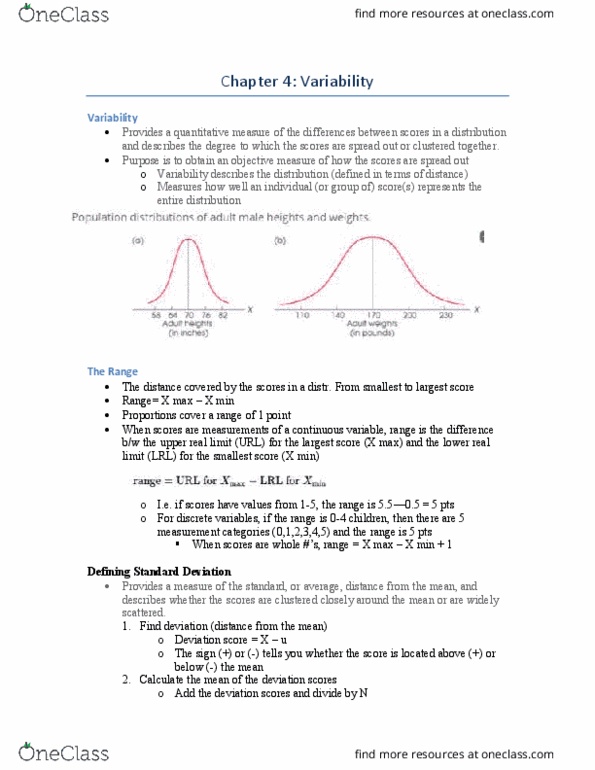
SD: the spread from the mean!
Will tell you how much the data is distributed.
_
A = 48, 48, 48, 48, 48, 48, 48 x=48
B = 25, 30, 52, 53, 56, 58, 62 x=48
A = Sum(0, 0, 0, 0, 0, 0) = 0
B = Sum(-23, -18, 5, 4, 8, 10, 14) = 0
PROBLEM!
So we take the SQUARE of the distance!
B = (-232),(-182),(52), (42), (82), (102), (142) =1254
Divide by the number of samples & take the square
root!
S.D. = 13.4
-Descriptive: summarize
-Inferential: Analyze sample for relationships
among variables; Inferences about population
Z-Scores
_
How far a score is from the mean: z=x-x / s
z score of +2 = Two S.D. above the mean
Score of 81 with mean of 62 & SD of 7.5
z= 81-62 / 7.5 = 2.5
If you score 82% in Ethics, and 67% in
Latin,
which was better result ?
find more resources at oneclass.com
find more resources at oneclass.com
Document Summary
Generate a corresponding list indicating deviation from the mean. Generate a corresponding list indicating the square of each deviation. Generate the square root of the (squared deviations mean) Will tell you how much the data is distributed. B = 25, 30, 52, 53, 56, 58, 62 x=48 x=48. A = sum(0, 0, 0, 0, 0, 0) = 0. B = sum(-23, -18, 5, 4, 8, 10, 14) = 0. So we take the square of the distance! B = (-232),(-182),(52), (42), (82), (102), (142) =1254. Divide by the number of samples & take the square root! Inferential: analyze sample for relationships among variables; inferences about population. How far a score is from the mean: z=x-x / s z score of +2 = two s. d. above the mean. Score of 81 with mean of 62 & sd of 7. 5 z= 81-62 / 7. 5 = 2. 5. If you score 82% in ethics, and 67% in.