ADM 1340 Lecture Notes - Lecture 4: Historical Cost, Faithful Representation, Retained Earnings


ADM 1340 Full Course Notes
Document Summary
Get access


Related Documents
Related Questions
The following is the abridged statement of the financial position of Cromwell Ltd
| Assets | |
| Non-current assets | |
| Land & buildings | 500,000 |
| Current assets | |
| Cash & cash equivalents | 12,000 |
| Total assets | 512,000 |
| Equity & Liabilities | |
| Total equity | (130,000) |
| -Issued capital | 320,000 |
| Accumulated loss | (450,000) |
| Current laibilities | |
| Trade payables | 642,000 |
| Total equity & Liabilities | 512,000 |
Additional information:
- A reasonable market value for the assets is equal to the book values
- The creditors are prepared to enter into a compromise in order to prevent liquidation
- There is a predicted future profit of $300,000 per annum
- The tax rate is 30%
- The shareholders have indicated that they are considering buying the land and buildings if Cromwell is liquidated
Determine whether Cromwell Ltd should be liquidated or whther the company should rather perform a reconstruction. Show all calculations
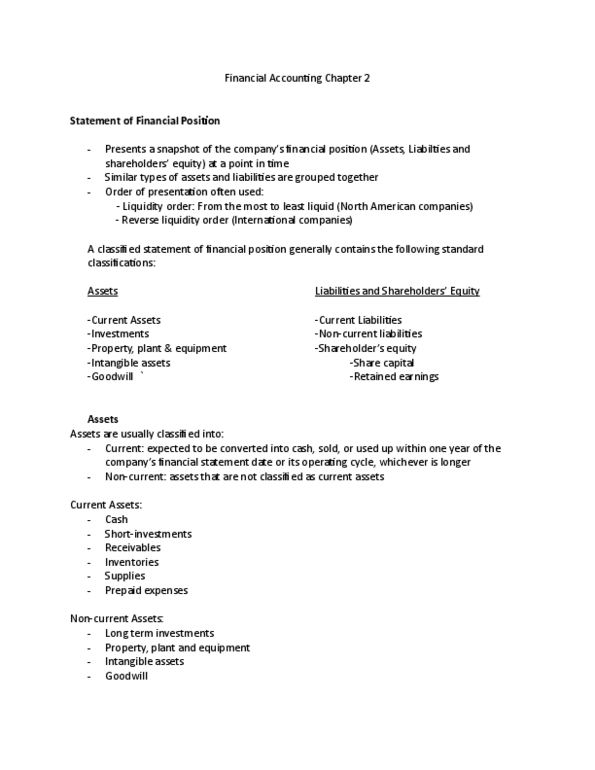
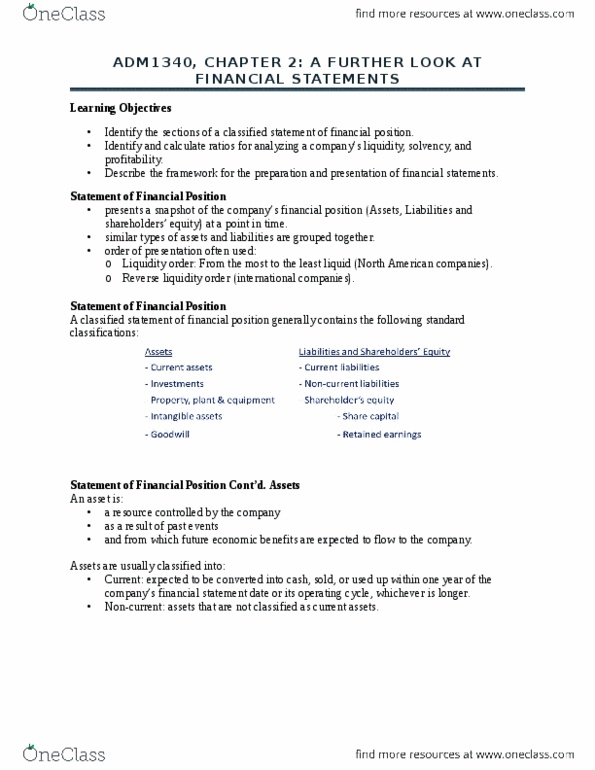
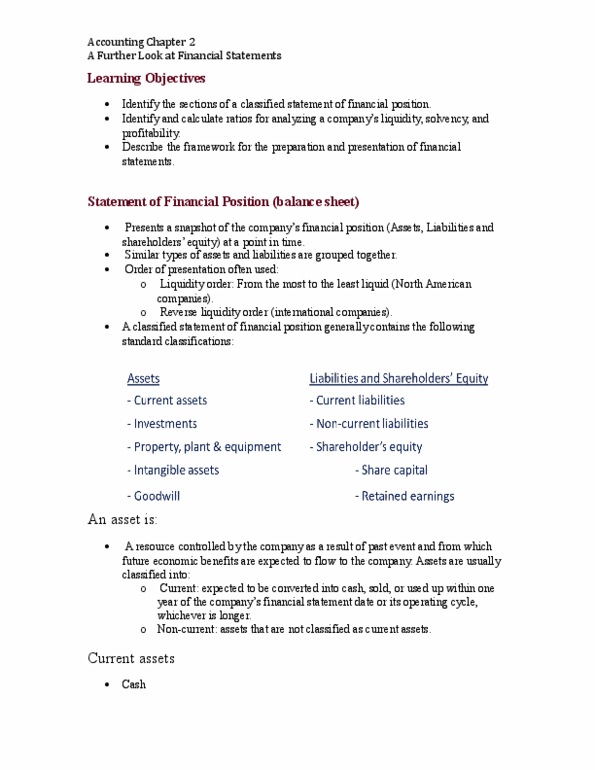
2. Balance sheet
The balance sheet provides a snapshot of the financial conditionof a company. Investors and analysts use the information given onthe balance sheet and other financial statements to make severalinterpretations regarding the companyâs financial condition andperformance.
Blue Hamster Manufacturing Inc. is a hypothetical company.Suppose it has the following balance sheet items reported at theend of its first year of operation. For the second year, some partsare still incomplete. Use the information given to complete thebalance sheets for Blue Hamster Manufacturing Inc. for the yearsending December 31, Year 2 and 1, respectively.
Blue Hamster Manufacturing Inc. | |||||
|---|---|---|---|---|---|
Balance Sheet | |||||
For the Year ended December 31 | |||||
| Year 2 | Year 1 | Year 2 | Year 1 | ||
| Assets | Liabilities and equity | ||||
| Current assets: | Current liabilities: | ||||
| Cash and equivalents | $55,350 | Accounts payable | $0 | $0 | |
| Accounts receivable | $25,312 | $20,250 | Accruals | $3,516 | $0 |
| Inventories | $74,250 | $59,400 | Notes payable | $19,921 | $18,750 |
| Total current assets | $168,750 | $135,000 | Total current liabilities | $18,750 | |
| Net fixed assets: | Long-term debt | $70,312 | $56,250 | ||
| Net plant and equipment | $165,000 | Total debt | $93,750 | $75,000 | |
| Common equity: | |||||
| Common stock | $182,812 | $146,250 | |||
| Retained earnings | $78,750 | ||||
| Total common equity | $281,250 | $225,000 | |||
| Total assets | $375,000 | $300,000 | Total liabilities and equity | $375,000 | $300,000 |
Given the information in the preceding balance sheetâandassuming that Blue Hamster Manufacturing Inc. has 50 million sharesof common stock outstandingâread each of the following statements,then identify the selection that best interprets the informationconveyed by the balance sheet.
Statement #1: Blue Hamsterâs pool of relatively liquid assets,which are available to support the companyâs current and futuresales, decreased from Year 1 to Year 2.
This statement is , because:
Blue Hamsterâs total current liabilities balance decreased by$33,750 between Year 1 and Year 2.
Blue Hamsterâs total current liabilities balance increased from$20,250 to $25,312 between Year 1 and Year 2.
Blue Hamsterâs total current asset balance actually increasedfrom $135,000 to $168,750 between Year 1 and Year 2.
Blue Hamsterâs total current asset balance decreased from$168,750 to $135,000 between Year 1 and Year 2.
Statement #2: In Year 2, Blue Hamster Manufacturing Inc. wasprofitable.
This statement is , because:
Blue Hamsterâs retained earnings account increased between theend of Years 1 and 2.
The cash and equivalents account increased between Years 1 and2.
Blue Hamsterâs total assets increased between Years 1 and 2.
Statement #3: The book value per share of Blue Hamsterâs stockin Year 2 was $5,625.
This statement is , because:
The per-share book value is calculated by dividing the companyâstotal assets by the number of outstanding shares of commonstock.
The per-share book value is calculated by dividing the companyâstotal debt by the number of outstanding shares of common stock.
The per-share book value is calculated by dividing the companyâstotal common equity by the number of outstanding shares of commonstock.
Based on your understanding of the different items reported onthe balance sheet and the information they provide, if everythingelse remains the same, then the cash and equivalents item on thecurrent balance sheet is likely to if the firm issues$3 million of new common stock.
Based on your understanding of the different items reported inthe balance sheet and the information they provide, which statementregarding Blue Hamster Manufacturing Inc.âs balance sheet isconsistent with U.S. Generally Accepted Accounting Principles(GAAP)?
The companyâs assets should be listed in alphabetical order.
The companyâs assets should be listed in the order in which theyare to be converted into cash.
The companyâs assets should be listed from those carrying thelargest balance to those with the smallest balance.

| Problem 4-23 Data for Barry Computer Co. and its industry averages follow.
Construct the Du Pont equation for both Barry and the industry. Round your answers to two decimal places.
a)The firm's days sales outstanding is more than the industry average, indicating that the firm should tighten credit or enforce a more stringent collection policy. The total assets turnover ratio is well above the industry average so sales should be increased, assets increased, or both. While the company's profit margin is higher than the industry average, its other profitability ratios are low compared to the industry - net income should be higher given the amount of equity and assets. However, the company seems to be in an above average liquidity position and financial leverage is similar to others in the industry. b)The firm's days sales outstanding is comparable to the industry average, indicating that the firm should neither tighten credit nor enforce a more stringent collection policy. The total assets turnover ratio is well below the industry average so sales should be increased, assets increased, or both. While the company's profit margin is higher than the industry average, its other profitability ratios are low compared to the industry - net income should be higher given the amount of equity and assets. However, the company seems to be in a below average liquidity position and financial leverage is similar to others in the industry. c)The firm's days sales outstanding ratio is more than twice as long as the industry average, indicating that the firm should tighten credit or enforce a more stringent collection policy. The total assets turnover ratio is well below the industry average so sales should be increased, assets decreased, or both. While the company's profit margin is higher than the industry average, its other profitability ratios are low compared to the industry - net income should be higher given the amount of equity and assets. However, the company seems to be in an average liquidity position and financial leverage is similar to others in the industry. d)The firm's days sales outstanding is more than twice as long as the industry average, indicating that the firm should loosen credit or apply a less stringent collection policy. The total assets turnover ratio is well below the industry average so sales should be increased, assets increased, or both. While the company's profit margin is higher than the industry average, its other profitability ratios are low compared to the industry - net income should be higher given the amount of equity and assets. However, the company seems to be in an average liquidity position and financial leverage is similar to others in the industry. e)The firm's days sales outstanding is less than the industry average, indicating that the firm should tighten credit or enforce a more stringent collection policy. The total assets turnover ratio is well below the industry average so sales should be increased, assets decreased, or both. While the company's profit margin is lower than the industry average, its other profitability ratios are high compared to the industry - net income should be higher given the amount of equity and assets. However, the company seems to be in an average liquidity position and financial leverage is similar to others in the industry. 3) Suppose Barry had doubled its sales as well as its inventories, accounts receivable, and common equity during 2014. How would that information affect the validity of your ratio analysis? (Hint: Think about averages and the effects of rapid growth on ratios if averages are not used. No calculations are needed.) Select true statement a) If 2014 represents a period of supernormal growth for the firm, ratios based on this year will be accurate and a comparison between them and industry averages will have substantial meaning. Potential investors need only look at 2014 ratios to be well informed, and a return to normal conditions in 2013 could help the firm's stock price. b) If 2014 represents a period of normal growth for the firm, ratios based on this year will be distorted and a comparison between them and industry averages will have little meaning. Potential investors who look only at 2014 ratios will be misled, and a continuation of normal conditions in 2013 could hurt the firm's stock price. c) If 2014 represents a period of normal growth for the firm, ratios based on this year will be accurate and a comparison between them and industry averages will have substantial meaning. Potential investors who look only at 2014 ratios will be misled, and a return to supernormal conditions in 2013 could hurt the firm's stock price. d) If 2014 represents a period of supernormal growth for the firm, ratios based on this year will be distorted and a comparison between them and industry averages will have substantial meaning. Potential investors who look only at 2014 ratios will be well informed, and a return to normal conditions in 2013 could hurt the firm's stock price. e) If 2014 represents a period of supernormal growth for the firm, ratios based on this year will be distorted and a comparison between them and industry averages will have little meaning. Potential investors who look only at 2014 ratios will be misled, and a return to normal conditions in 2013 could hurt the firm's stock price. | ||||||||||||||||||||||||||||||||||||||||||||||||||||||||||||||||||||||||||||||||||||||||||||||||||||||||||||||||||||||||||