BIO304H5 Lecture 7: BIO304H5 Lecture : Lecture 7 bio 304

Document Summary
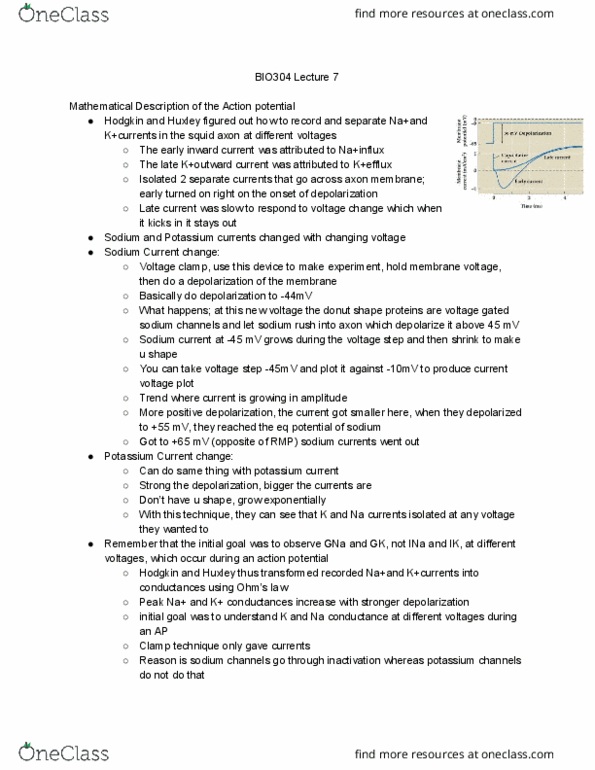
When -30, current became -50ma, plot it onto voltage step graph. As current is growing in amplitude, it is depolarizing. Then something weird happened, current grew then again began to drop. At 55mv, current became completely flat at 0ma. At 65mv, na went out like k, it created this curve like a v-shape on the voltage step. Integrate voltage gated channel by hudson to actual molecular properties in nervous system. Late current=sluggish response, once it kicks in, it stays out. Amplifier inject opposite depolarizing current to change voltage at axon from -65 to -45. Sodium channels go under deactivation where they shut down that why they have a different curve in the recorded current compared to k"s recorded current. Understand k and na to understand action potential. In sodium we transformed the current into conductances. Able to use equations to draw these exact same curves and that is what hodgkin and h did.