PSY201H5 Lecture Notes - Lecture 4: Descriptive Statistics, Squared Deviations From The Mean, Sampling Error

Document Summary
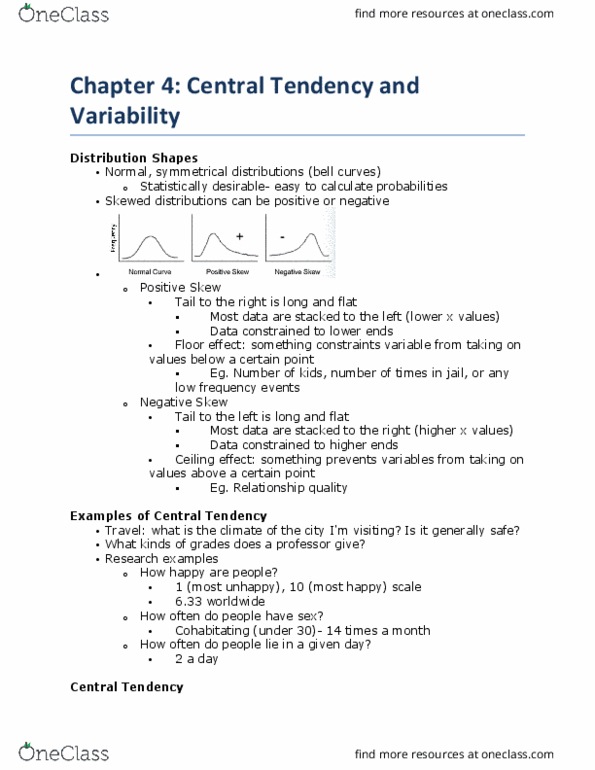
Define, know properties of + give an ex of mean, median + mode. Most data stacked to left (lower x values) = something constraints variable from taking on values below a certain point. # of kids, # of times in jail, or any low frequency events. Most data stacked to right (lower x values) Data constrained to higher ends of the data. = something prevents variables from taking on values above a certain point. What kinds of grades does a prof give: research ex. How happy are people: a descriptive statistic that best describes center of data or most typical score, what is most representative of the group, 3 central tendencies. Add up all #s/how many #s = 72+81+60/3 = 173 71. All scores affect mean, bc all scores are used to calculate mean. The mean is like a balance pt, place where scores are balanced on both sides.