PSYA01H3 Chapter Notes - Chapter 2: Standard Deviation, Null Hypothesis, Statistical Significance

Document Summary
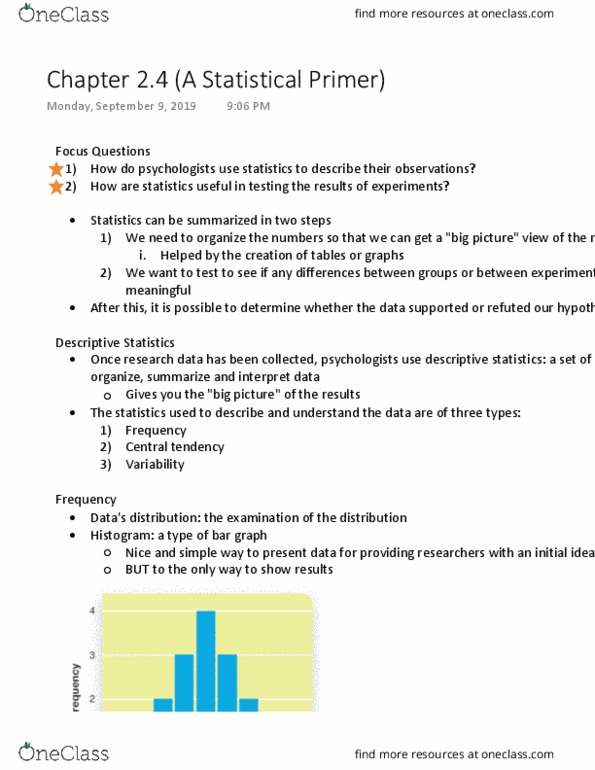
Statistics in 2 steps: need to organize the numbers to get the big picture of results (ex: tables & graphs, test to see if any differences between groups/experimental conditions are meaningful. Descriptive statistics: set of techniques used to organize, summarize, and interpret data: gives big picture of results, frequency: (vertical axis) number of observations that fall within a certain category or range of scores. Whether some scores occurred more than others. Whether all of the scores were clumped in the middle or more spread out. Usually in a histogram or bar graph. Histogram: easy to describe distribution of scores. Skews occur because there is an upper/lower limit to the data: central tendency: measure of the central point of a distribution. Mean: arithmetic average of a set of numbers. Often used when data is normally distributed. Median: 50th percentile the point on the horizontal axis at which 50% of all observations are lower, and 50% of all observations are higher.