SOC222H5 Lecture Notes - Lecture 7: Spurious Relationship, Interval Ratio

Document Summary
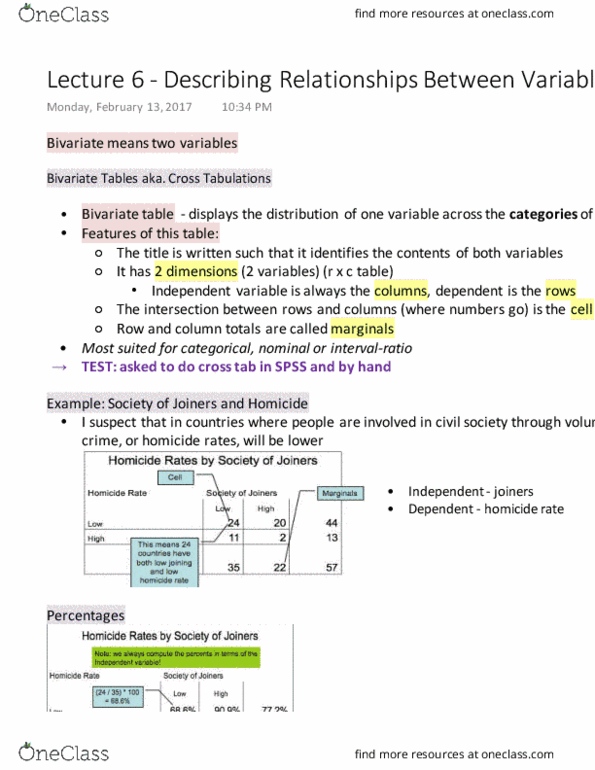
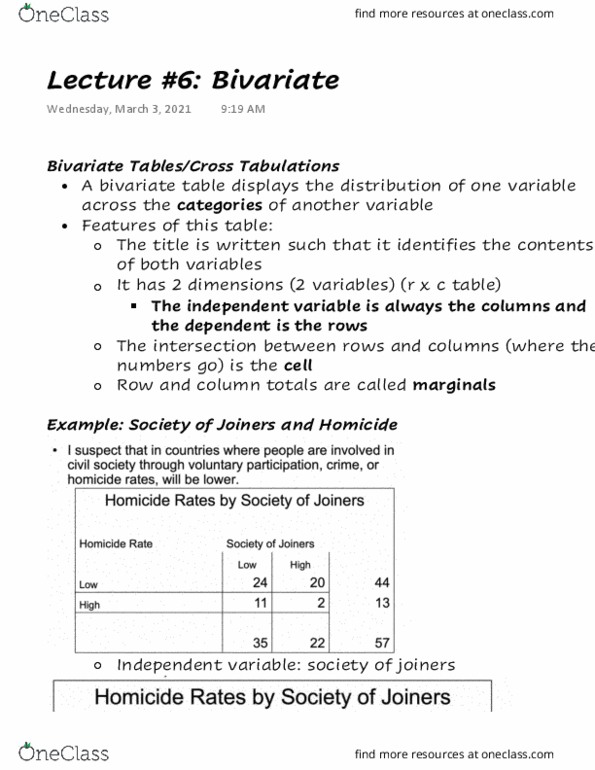
Looking at how two variables are related. There is only one independent variable affecting dependent variable. Effects of other variables on dependant variable. How cases are with intersections of two variables. They have to be categorical in some way as they aren"t interval ratio. Columns of a cross table are the attributes of the independent variable and rows are the dependant variable, that is always the case. Dependant variable: should have less homicide rates. 26 cases don"t really fit the hypothesis: low and low, high and high. For any frequency table having raw data is helpful. 24 divided by column total and multiply by 100. Generally have 10% difference, otherwise there isn"t any variance, rule of thumb, not precise, going across the column, can"t use the rule if not converted to percents. Majority of cases are in same order pairs- unwilling and unwilling, willing and willing. This is an interpretation of a cross tab.