STA215H5 Lecture Notes - Lecture 9: Dependent And Independent Variables, Scatter Plot, Negative Number

Document Summary
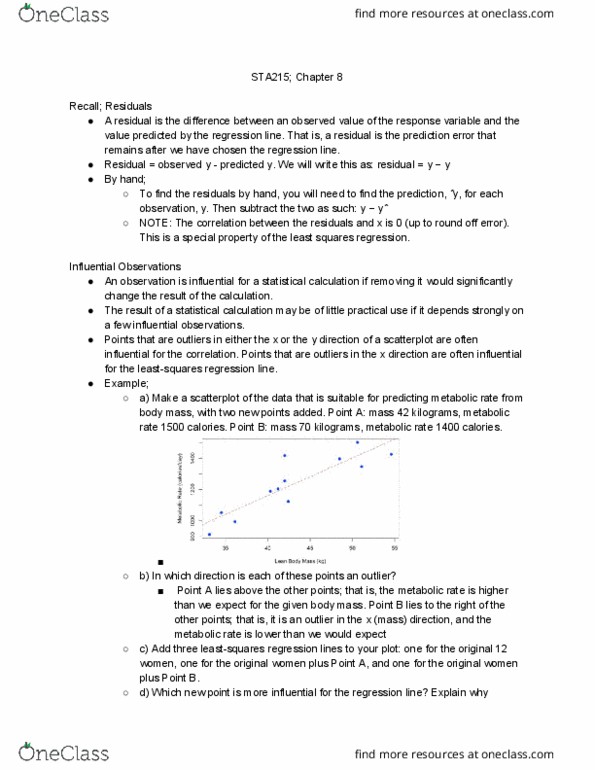
Indicates criterion of line which indicates the data in the best way: residual = error, error of particular observation and actual observation and square distance, least-squares regression line minimizes sum of those errors, 1. The distinction between explanatory and response variables is essential in regression: 2. The least-squares regression line always passes through the point ( x, y) on the graph of y against x: 3. Here are data on the farm population (millions of persons)from 1935 to 1980: a, the scatterplot shows a strong negative association with a straight-line pattern. What percent of the observed variation in farm population is accounted for by linear changeover time: find r and r2. May 29th 2019: this is the slope - about 0. 587 million (587,000) per year during this period. Because r 0. 9884, the regression line explainsr2 97. 7% of the variation in population: c) use the regression equation (trend line) to predict the number of people living on farms in 1990.