Psychology 1000 Lecture Notes - Lecture 7: Normal Distribution, Standard Deviation, Frequency Distribution

13 Feb 2017
School
Department
Course
Professor


111
PSYCH 1000 Full Course Notes
Verified Note
111 documents
Document Summary
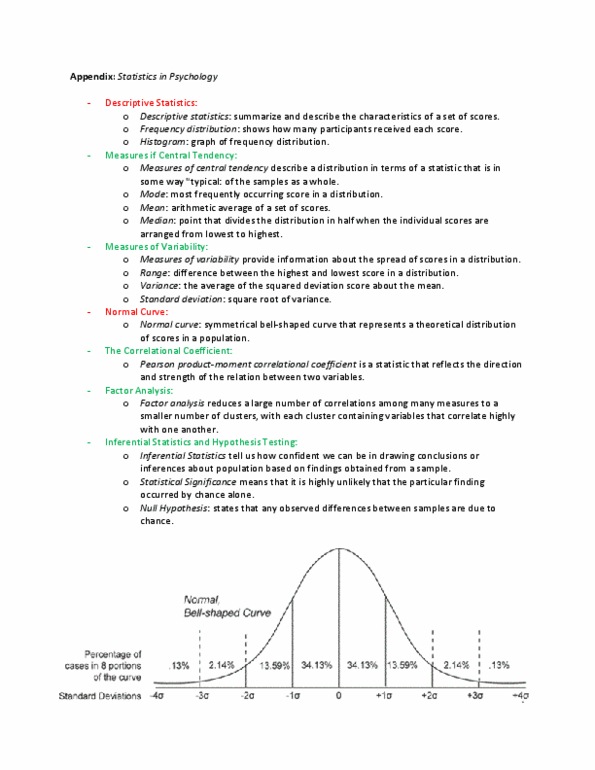
Statistics: measures of central tendency, distribution. Descriptive statistics summarize and describe the characteristics of a set of scores. Frequency distribution show how many participants received each score. The average of the set of scores: the arithmetic average. Median the point that divides the distribution in half when the individual scores are arranged in order from lowest to highest. Mode the most frequently occurring score in the distribution. Descriptive statistics: summarize and describe characteristics of a set (or distributor) of data (or scores, frequency distribution. Representation of how many individuals received a particular score or belong to a particular category: histogram. Graphical representation of a frequency distribution: frequency distributions and histograms provide general information, sometimes nice to know what the typical score is in a distribution. Number of times students yawned during a boring class. No because 75 is way off while most are below 20.