Statistical Sciences 1024A/B Lecture 18: Stats Lec 18

5 Nov 2018
School
Department
Professor
Document Summary
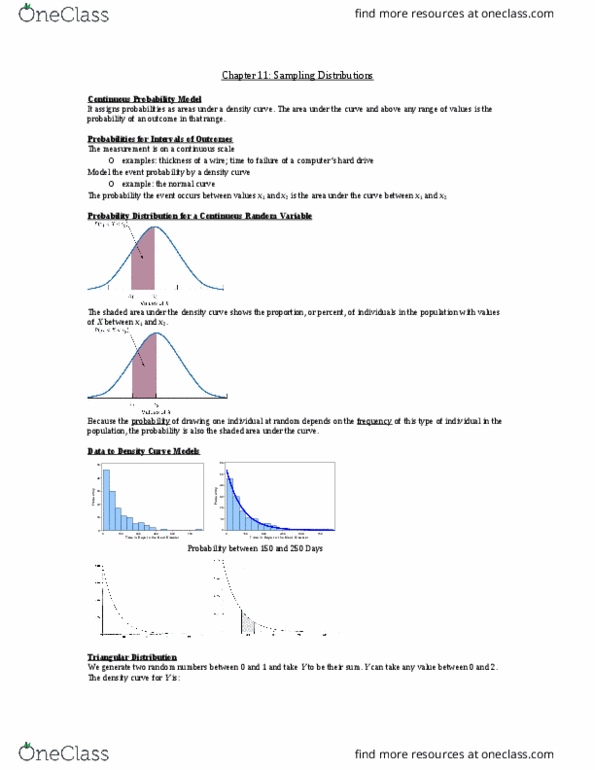
A probability model is de ned by 2 things: the sample space s. Ie. s = {1,2,3,4,5,6} for a 6-sided die: the function p (__) takes elements of s and assigns them a number. Continuous probability model: assigns probabilities as areas under a density curce. The area under the curve and above any range of values is the probability of an outcome in that range. A continuous probability model has the added requirements to the probability model that: the sample space s is an interval, the probability function p must accept intervals as input. These types of probability functions= probability density curves. Ie. thickness of a wire, s= (0, in nity) Ie. uniform density, triangle density, the normal curve. Remember: the shaded area under the density curve= proportion of individuals in the population. Because the probability of drawing 1 individual at random, depends on the.