Statistical Sciences 1024A/B Lecture Notes - Lecture 6: Contingency Table, Dependent And Independent Variables, Marginal Distribution

20 Apr 2016
School
Department
Professor
Document Summary
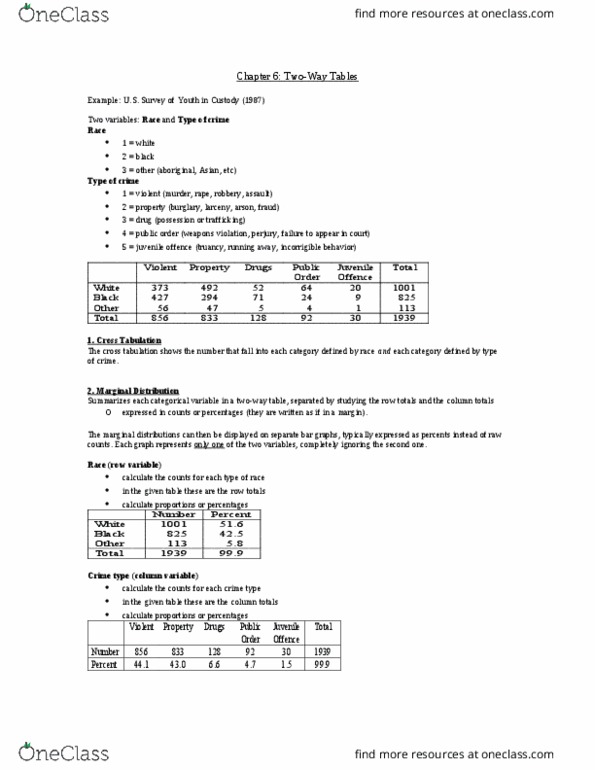
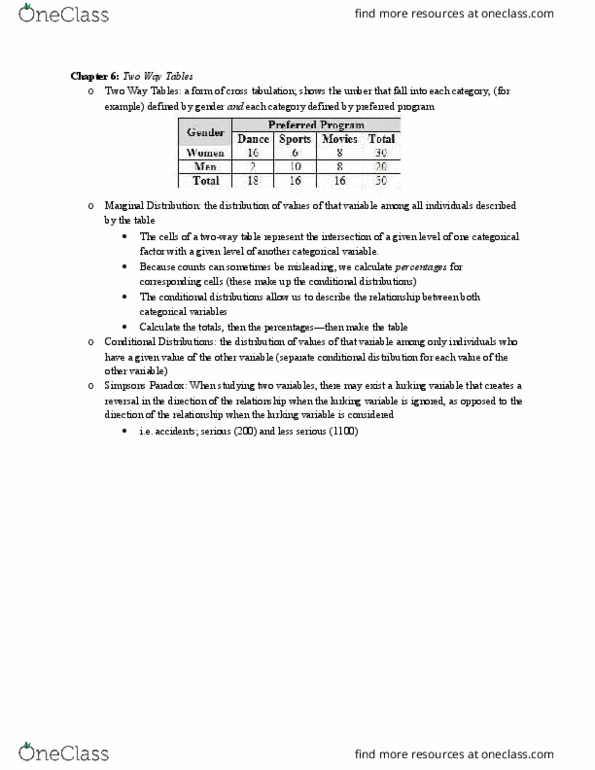
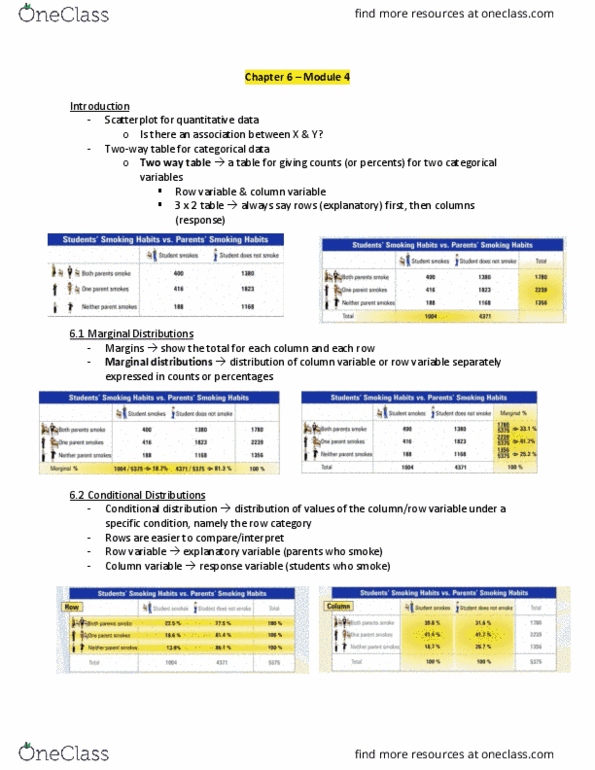
Example: us survey of youth in custody (1987) Two categorical variables: race and type of crime. 4= public order (weapons violation, perjury, failure to appear in court) 5= juvenile offence (truancy, running away, incorrigible behaviour) 1,939 total cases (a subsample of a bigger survey file) classified in two ways. The cross tabulation shows the number that falls into each category defined by race and each category defined by type of crime. If row and column totals are missing, the first thing to do is to calculate them. Look at the distribution of each variable separately. A conditional distribution of a variable is the distribution of values of that variable among only individuals who have a given value of the other variable. There is a separate conditional distribution for each value of the other variable. We can look at each categorical variable in a two-way table separately by studying the row totals and the column totals.