Statistical Sciences 2244A/B Lecture Notes - Lecture 12: Random Variable, Confidence Interval, Binomial Distribution
11 Nov 2016
School
Department
Professor
Document Summary
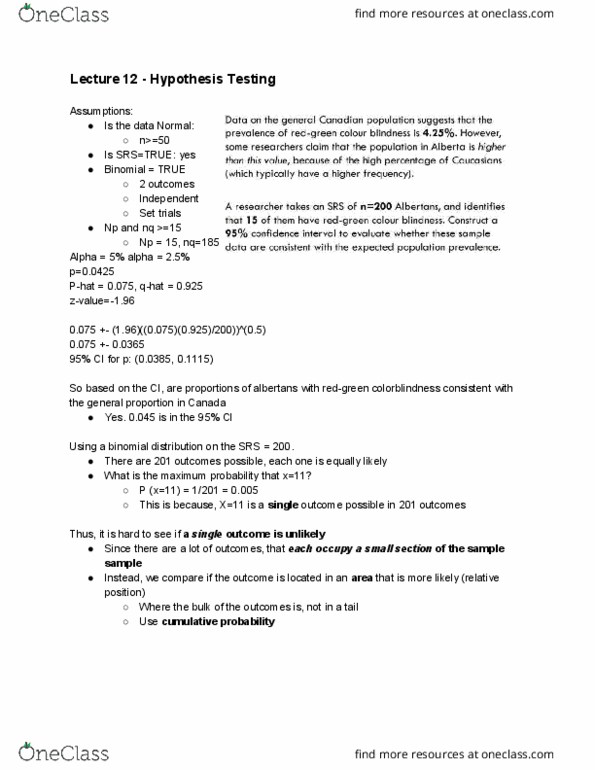
Data on the general canadian population suggests that the prevalence of red-green colour blindness is 4. 25%. However, some researchers claim that the population in alberta is higher than this value, because of the high percentage of caucasians (which typically have a higher frequency). A researcher takes an srs of n=200 albertans, and identifies that 15 of them have red-green colour blindness. Construct a 95% confidence interval to evaluate whether these sample data are consistent with the expected population prevalence. Yes, n = 200: x ~ b(n,p, 2 outcomes, set number of trials, independent trials, constant p, z is a good approximation of b, = 15, = 185. The 95% confidence interval for p is (0. 0385, 0. 112) 0. 0425 falls within this range reasonable that the real proportion of rg colour blindness falls in. We can test a claim of a sample to see if the sample falls within the confidence interval. We can simple solve by calculating via binomial probability where.