Statistical Sciences 2244A/B Lecture 16: 2244-Lec 16

22 Nov 2016
School
Department
Professor
Document Summary
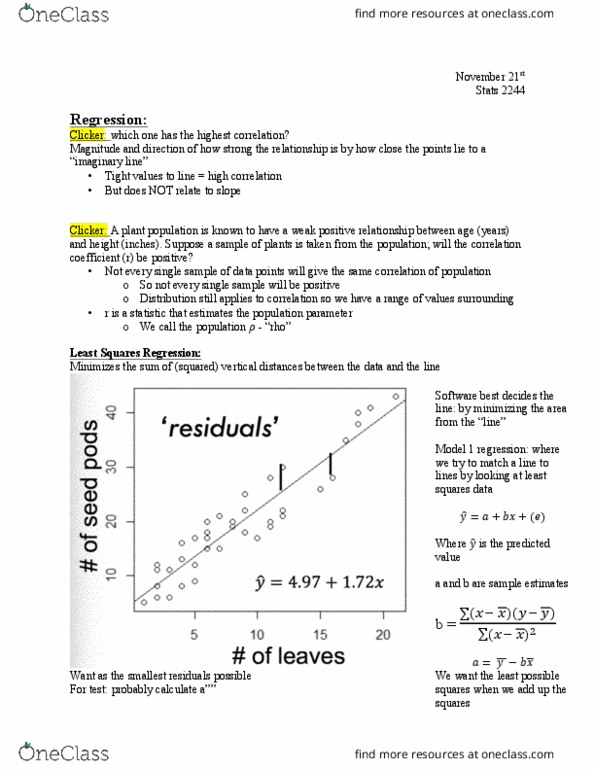
Watch video in lab 5 folder that will come out on wednesday. Will have a pre-lecture quiz due on. Regression has same process as hypothesis tests. Question: which scatter shows the highest correlation? (the axes are identical) Slope has no affect on correlation it just tells you direction (+ or -) Question: a plant population is known to have a weak positive relationship between age (years) and height (inches). Depends on which points you are looking at. Least squares regression line is in the graph. its sums of square. Residuals is difference between data points and regression line. Take the residual and square it this gives us a box than add p all their areas so they are no longer neg. or positive. We want the sum of all the areas to be very small hence the least square regression. Y-hat has the equation (mx+b) as (bx+a) And to get the y-int we use the equation a= on the slide.