CC100 Lecture Notes - Lecture 3: Robert Pickton, Summary Offence, Risk Assessment


Chapter 3: Measuring Crime and Criminal Behaviour
Outline:
● Why criminologists need data
● Official sources of crime data
● Factors affecting crime data
● The general aims of research
Kim Rossmo
● Noticed people develop patterns in the places they go
● Women who worked in sex trade disappeared
● Looked at patterns/trends in cases, discovered serial killer
● Robert Pickton → killed estimates 30-40 women
● Police didn’t trust Rossmo’s formula
● Picton arrested by old fashioned methods (interviewing people, checking his history etc)
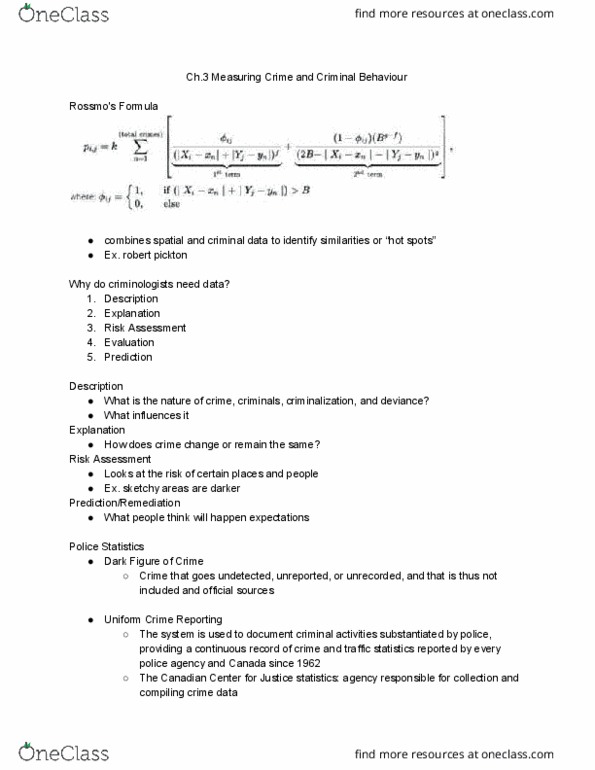
Rossmo’s Formula
● Combines spatial and criminal data
● Identifies similarities “hot spots”
● Robert Pickton???
● (Add up different factors in crime, will pick up patterns and likely find where criminal is)
Why Criminologists Need Data
1) Description
2) Explanation
3) Evaluation
4) Risk assessment
5) Prediction
1) Description
● What is nature of crime, criminals, criminalization and deviance?
● What influences it?
2) Explanation
● How does crime change or remain the same?
● Charts of crime data from 2015 show that crime severity is decreasing, extremely low in
terms of relative violence… other chart shows that overall crime rate (crimes per 100
000 people) peaked in 1994 and has been on a steady decline (we have a lower crime
rate than in the 1970s)
3) Evaluation
● Can use data to evaluate
● E.g. spending on youth in jail
4) Risk Assessment
find more resources at oneclass.com
find more resources at oneclass.com

● Statistics/data about situation, find ways we can improve it
● Preventing crime
● Parking garage example → making public places safer
5) Prediction/Remediation
● When something bad happens or is about to happen, look at data and see expectations
● E.g. barbaric practices tipline
● Suggesting policies are not a good idea
Official Sources of Crime Data
● Police Statistics
○ Dark Figure of Crime: crime that goes undetected, unreported, or unrecorded,
and that is thus not included in official sources
○ Uniform Crime Reporting (UCR): system used to document criminal activity
substantiated by police, providing a continuous historical record of crime and
traffic statistics reported by every police agency in Canada since 1962
○ Canadian Centre for Justice Statistics (CCJS): agency responsible for
collecting and compiling crime on a wide range of criminological and criminal
justice topics
○ Police crime statistics are divided into three categories
■ Summary offences carry max penalty of 6 months in jail and/or a fine not
exceeding $5000 (unless different penalty is specified)
■ Indictable offences carry a max penalty of life imprisonment and no max
fine
■ Hybrid offences consist of crimes such as impaired driving and theft
under $5000, which the Crown may choose to prosecute as either
summary or indictable
● Government Agencies
○ Municipal data collection: programs in major cities collect and aggregate data
from various sources to develop metrics about neighbourhoods
○ Statistics canada: juristat → periodical review of justice issues, the daily → daily
reports about issues including justice, various surveys → general social survey,
homicide survey, police administration survey, violence against women, etc
● Judicial Statistics
○ Historically, court records were first type of official crime statistics to be collected
○ Beginning in early 19th century, information was gather on number of charges
and convictions that appeared before the courts, as well as the offender’s sex,
income, education, and occupation
○ Statistically, homicide more common between acquaintances or family
● Correctional Statistics
○ Data on people being held in federal and provincial corrections facilities,
including age, sex, offence, and prior convictions
find more resources at oneclass.com
find more resources at oneclass.com
Document Summary
Noticed people develop patterns in the places they go. Women who worked in sex trade disappeared. Looked at patterns/trends in cases, discovered serial killer. Robert pickton killed estimates 30-40 women. Picton arrested by old fashioned methods (interviewing people, checking his history etc) Robert pickton?? (add up different factors in crime, will pick up patterns and likely find where criminal is) Why criminologists need data: description, explanation, evaluation, risk assessment, prediction, description. Charts of crime data from 2015 show that crime severity is decreasing, extremely low in terms of relative violence other chart shows that overall crime rate (crimes per 100. 000 people) peaked in 1994 and has been on a steady decline (we have a lower crime rate than in the 1970s: evaluation. E. g. spending on youth in jail: risk assessment. Statistics/data about situation, find ways we can improve it. Parking garage example making public places safer: prediction/remediation.