GLG 101 Lecture Notes - Absorbance, Mark Daniels, Spectrophotometry

Developing a Growth Curve Using a Spectrophotometer and 96-
Well Plate Procedures
Jessica Klitzke
TA: Mark Daniels
MicBio 3301
March 2, 2017
Abstract
The first step to understanding a microbe and manipulating it is to understand its pattern of
growth under specified conditions. Escherichia coli is an abundant microbe that serves many
purposes – good and bad. Because of its high prevalence, understanding its growth patterns is
highly important. This experiment explores those realms by following procedure to generate a
standard curve as well as a growth curve. Two methods, a spectrophotometer and a 96-well plate
reader, were used to monitor optical density of an inoculated solution over time. To observe and
quantify growth (viable count) over time, dilutions of the inoculum were plated and incubated
and the colonies were late counted to determine colony forming units per milliliter (CFUs/ml).
These results produced a standard curve as well as the two components of a growth curve. The
results revealed that as the incubation time increased, the cell concentration within the suspended
solution increased which therefore increased the optical density value. The growth curve showed
evidence of the lag phase as well as the exponential phase. The curves also showed less
definition in the 96-well plate results compared to the spectrophotometer results due to the small
volumes used. However, the 96-well plate method produced more useful data overall.
Introduction
A growth curve is a tool used to monitor and quantify microbial growth within a population over
time. The measurement used to quantify the microbes over time is the cell count. The graph
consists of four stages; the lag phase, the exponential or log phase, the stationary phase, and the
death phase. This experiment was designed to readily observe this phenomenon, particularly
emphasizing the exponential (log) phase which is where the microbes are multiplying at a steady
rate. Generation time is the value that defines the rate of multiplication, specifically, how long it
takes the microbial population to double in viable cell count. As for the other three stages,
generally no growth is occurring. In the lag phase, the original cells are acclimating to their
environment and are preparing for multiplication. In the stationary phase, the microbial
population has met its capacity based on the nutrients and space available and each individual
cell is fighting for survival. Here is where cells would begin acclimating to their densely
populated environment and alter their living needs in order to survive. Some types of microbes
may have the ability to become dormant and encase themselves in a capsule, which then would
allow that cell to survive in the famine conditions. The last phase is the death phase, where cells
gradually die due to the depletion of available nutrients. The cells who adjusted during the
stationary phase will survive longer in this phase.
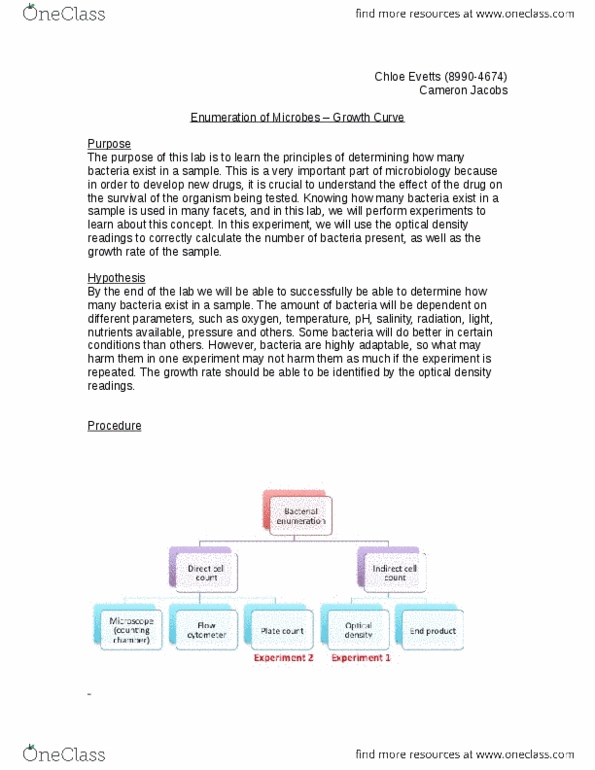
There are three main methods of generating cell counts: direct count, turbidimetric analysis, and
dilution plate count (a viable count method). Direct count is done using a Petroff-Hausser
Counting Chamber. This method is simple and quick, but the observer is not able to distinguish
between living and nonliving cells. Turbidimetric analysis is done using a spectrophotometer and
obtaining the optical density of bacterial suspension. This method is quick, easy, and sensitive
and also informative; the amount of scattered light is directly proportional to the amount of cells.
Klitzke 2
In other words, the higher the optical density reading equals a more turbid solution which, in
return, equals a more densely population suspension of bacteria. The third method, a dilution
plate count, can be done by using a sidearm flask and a spectrophotometer or a 96-well plate and
a plate reader – each giving optical density readings of samples over time. A viable count is
calculated and reported in colony forming units (CFUs). This method is preferred because live
cells can be distinguished from dead ones, therefore yielding a count of viable cells versus total
cells.
This particular experience was designed to explore the growth of Escherichia coli via
turbidimetric analysis and direct count procedures. By obtaining this data, a standard curve and a
growth curve can be created from which the generation time can be accurately determined.
Material and Methods
Of the three means of analysis, two of them were used in this experiment – turbidimetric analysis
and direct count. A standard curve and a growth curve were generated from these two modes of
analysis, respectively.
As mentioned earlier, turbidimetric analysis is done by using a spectrophotometer to measure the
turbidity of the bacterial suspension which then reports a corresponding optical density value.
These values are collected and plotted to form a standard curve. To execute this, seven 16 x 150
mm tubes, each containing 4 milliliters (ml) of tryptic soy broth (TSB), were used to perform 6
two-fold dilutions. The first tube was inoculated with 4 ml of the E. coli suspension which had
an initial cell concentration of
1.56 x10⁸
cells/ml, a 1:2 dilution. This tube was mixed
thoroughly before the extraction of 4 ml into the next tube, a 1:4 dilution. The procedure
continued for the remaining four tubes. To obtain the optical density readings for each, 3 ml of
each dilution was transferred to a separate 13 x 100 mm tube. The spectrophotometer reported
Klitzke 3