STP 231 Lecture Notes - Lecture 26: Null Hypothesis

Document Summary
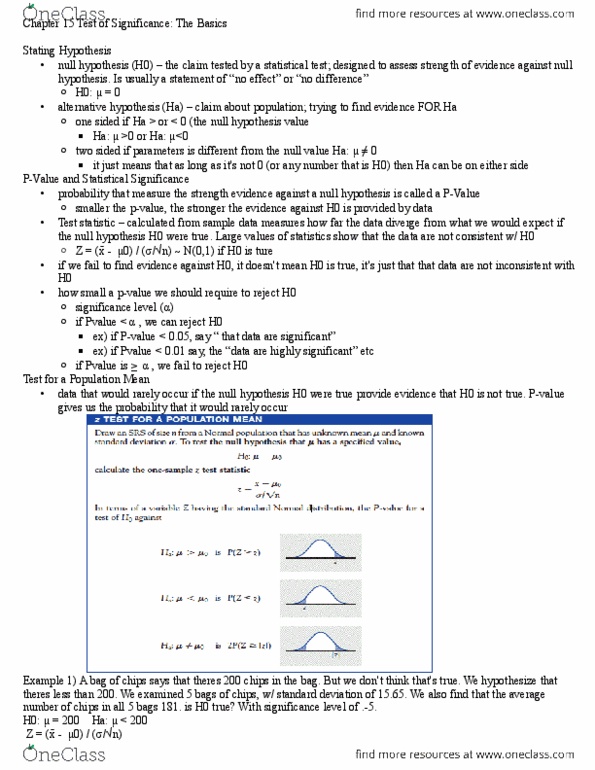
The p-value is the probability of getting a result as, or more extreme than, the result obtained from the sample, if h0 is true. To find p-value must convert to test statistics (apply t-curve formula) Then use calculation from that equation to find t-score values. We should look for everything that is towards the extremes from the p-value (so from p-value outward, not toward the center) when looking at a graph. The area in the extremes correspond to the t-score that gives us the calculation from above. (x-bar - 0) / ( /sqrt(n)) = an answer. This answer is made from using a t-score on the graph. That t-score is the area of an interval made from the t-score. If the p-value falls between two values on the t-score table, then use two t-values as limits. If alpha contains p, then we can have strong enough evidence to reject null hypothesis.