MTH 2003 Lecture 1: Section 1.1 PreCal- Graphs, Lines & Line Equation

2 Feb 2016
School
Department
Course
Professor
Document Summary
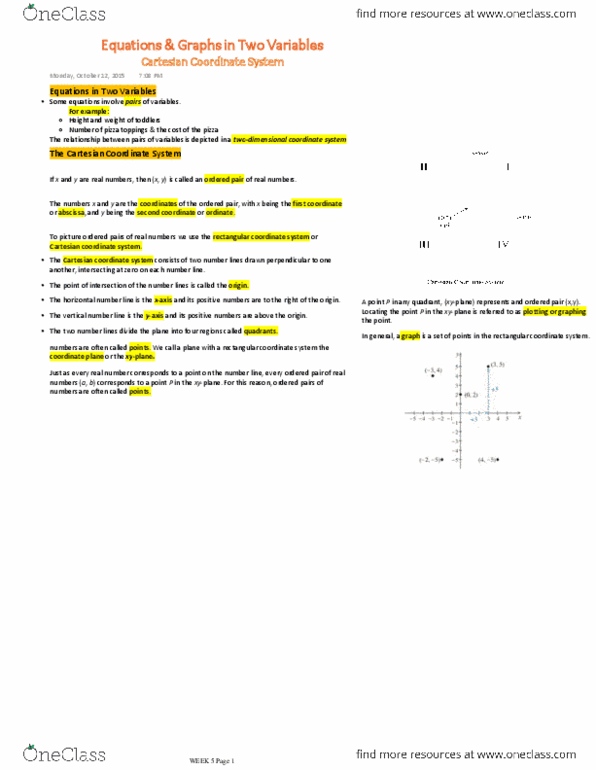
Section 1. 1: two dimensional rectangular coordinate system (aka graphs, lines & line equation) Consisting of all ordered pairs (x,y) in real numbers denoted by r2. Translation: graphs are used to show ordered pairs (x,y), lines, and line segments. Plot the following points on a graph (example afterwards): (-1,1) (2,1) (0,1) (2,0) Y=mx + b will be the foundation of everything you will learn in this course. Slope is the rate of change and can be defined as follows. Mx is defined as the line that passes through the origin. You can rewrite this equation in many ways and substitute different values for x and y but it remains the same thing. Keep in mind ( not crucial but something to remember) Y=x, this is a point on the line such as (4,4) Any negative coefficent of x slopes downwards always. This is an easy way to read an equation without doing much work.