CAS MA 115 Lecture Notes - Lecture 10: Null Hypothesis, Mobile Phone, Statistical Hypothesis Testing

1 May 2018
School
Department
Course
Professor

CHAPTER 10 – HYPOTHESIS TESTS REGARDING A PARAMETER
Section 10.1 – Language of Hypothesis Testing
Objective 1 – Determine the Null and Alternative Hypothesis
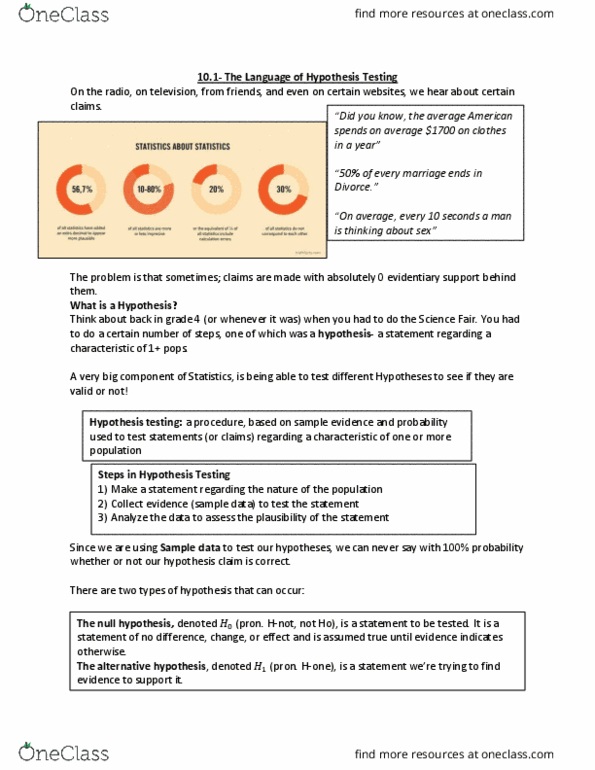
• Hypothesis – a statement regarding a characteristic of one or more populations
o ex: According to a study published in March, 2006 the mean length of a phone
call on a cellular telephone was 3.25 minutes. A researcher believes that the mean
length of a call has increased since then.
• Hypothesis Testing – a procedure based on sample evidence and probability, used to test
statements regarding a characteristic of one of more populations
o Steps in Testing:
▪ 1. Make a statement regarding the nature of the population
▪ 2. Collect evidence (sample data) to test the statement
▪ 4. Analyze the data to assess the plausibility of the statement
• Null Hypothesis (H0) – a statement to be tested
o Important to note that this statement has no charge, no effect and no difference
and is assumed true until evidence indicates otherwise
• Alternative Hypothesis (H1) - a statement that we are trying to find evidence to support
• Three Ways to Set up Null & Alternative Hypotheses
o 1. Equal v. Not Equal Hypothesis (two-tailed test)
▪ H0 – parameter = some value
▪ H1 – parameter some value
▪ Essentially a parameter no longer equals a currently claimed value
o 2. Equal v. Less Than (left-tailed test)
▪ H0 – parameter = some value
▪ H1 – parameter < some value
▪ Essentially a parameter is less than a currently claimed value
o 3. Equal v. Greater Than (right-tailed test)
▪ H0 – parameter = some value
▪ H1 – parameter > some value
▪ Essentially a parameter is more than a currently claimed value
• ex: state the type of test, the null hypothesis and alternative hypothesis for each example
o 1. In 2008, 62% of American adults regularly volunteered their time for charity
work. A researcher believes that this percentage is different today.
▪ This is a two-tailed test
▪ The null hypothesis is H0: p = 0.62
▪ The alternative hypothesis is H1: p 0.62
o 2. According to a study published in March, 2006 the mean length of a phone call
on a cellular telephone was 3.25 minutes. A researcher believes that the mean
length of a call has increased since then.
▪ This is a right-tailed test
▪ The null hypothesis is H0: u = 3.25
▪ The alternative hypothesis is H1: u > 3.25
find more resources at oneclass.com
find more resources at oneclass.com

o 3. Using an old manufacturing process, the standard deviation of the amount of
wine put in a bottle was 0.23 ounces. With new equipment, the quality control
manager believes the standard deviation has decreased.
▪ This is a left-tailed test
▪ The null hypothesis is H0: σ = 0.23
▪ The alternative hypothesis is H1: σ < 0.23
Objective 2 – Explain Type I and Type II Errors
• 4 Outcomes from Hypothesis Testing
o Reject the null hypothesis when the alternative hypothesis is true
▪ This decision would be correct
o Do not reject the null hypothesis when the null hypothesis is true
▪ This decision would be correct
o Reject the null hypothesis when the null hypothesis is true
▪ This decision would be incorrect
▪ This type of error is called a Type I Error
o Do not reject the null hypothesis when the alternative hypothesis is true
▪ This decision would be incorrect
▪ This type of error is called a Type II Error
• ex: state examples of type I and type II errors for each scenario
o In 2008, 62% of American adults regularly volunteered their time for charity
work. A researcher believes that this percentage is different today.
▪ Type I Error – made if the researcher concludes that p 0.62 when the
true proportion of Americans 18 years or older who participated in some
form of charity work is currently 62%
▪ Type II Error – made if researcher concludes that p = 0.62 when the true
proportion of Americans 18 years or older who participated in some form
of charity work is different from 62%
o According to a study published in March, 2006 the mean length of a phone call on
a cellular telephone was 3.25 minutes. A researcher believes that the mean length
of a call has increased since then.
▪ Type I Error – if the researcher concludes that μ > 3.25 when, in fact, the
actual mean call length on a cellular phone is still 3.25 minutes
▪ Type II Error – occurs if the concludes that μ = 3.25 when, in fact, , the
actual mean call length on a cellular phone is longer than 3.25 minutes.
• Denotations
o () = P(Type I Error) = P(rejecting H0 when H0 is true)
o ß = P(Type II Error) = P(not rejecting H0 when H1 is true)
• Level of Significance () – the probability of making a type I error
o This is chosen by the researcher before the sample data is collected
• “In Other Words”
o As the probability of type I error increases, the probability of type II error
decreases
o As the probability of type II error increases, the probability of type I error
decreases
find more resources at oneclass.com
find more resources at oneclass.com

Objective 3 – State Conclusions to Hypothesis Tests
• Important to note that we never accept the null hypothesis because without access to an
entire population, the exact parameter is unknown
o Instead it is reasonable to say we do not reject the null hypothesis
▪ “Based on the evidence, we do not reject the null hypothesis”
o Address what the null hypothesis means before stating if there is
sufficient/insufficient evidence of it occurring.
• ex: According to a study published in March, 2006 the mean length of a phone call on a
cellular telephone was 3.25 minutes. A researcher believes that the mean length of a call
has increased since then. Suppose the sample evidence indicates that the null hypothesis
should be rejected. State the wording of the conclusion. Suppose the sample evidence
indicates that the null hypothesis should not be rejected. State the wording of the
conclusion.
o Since the null hypothesis (u = 3.25) is rejected, there is sufficient evidence that
the mean length of a phone call on a cell phone is greater than 3.25.
o Since the null hypothesis (u = 3.25) is not rejected, there is insufficient evidence
that the mean length of a phone call on a cell phone is greater than 3.25.
Section 10.2 – Hypothesis Tests for a Population Proportion
Objective 1 – Explain the Logic of Hypothesis Testing
• To test hypothesis regarding the population proportion, we use the following steps
provided that:
o The sample is obtained by simple random sampling
o np0(1 – p0) ≥ 10
o The sampled values are independent of each other
• Important to note that p0 = null hypothesis (assumed value of the population proportion)
• Statistically Significant Evidence – when observed results are unlikely, under the
assumption that the null hypothesis
o When results are found to be statistically significant, we reject the null hypothesis
o In order to determine this, we build a probability model
o We can consider the sample evidence to be statistically significance if the sample
proportion is too many standard deviations above the population proportion
• p-value – the probability of observing a sample statistic as extreme or more extreme than
one observed under the assumption that the null hypothesis is true
o Essentially an area
o Computed by using the binomial distribution
▪ ex: P-value = P(x < 3 assuming p = 0.105) = P(x = 0) + P(x = 1) +…+
Objective 2 – Test the Hypotheses About a Population Proportion
• RECALL:
o The best point estimate of p (the proportion of the population with a certain
characteristic) is given by:
▪ p^ =
find more resources at oneclass.com
find more resources at oneclass.com
Document Summary
Chapter 10 hypothesis tests regarding a parameter. Make a statement regarding the nature of the population: 2. Collect evidence (sample data) to test the statement: 4. Equal v. not equal hypothesis (two-tailed test: h0 parameter = some value, h1 parameter some value, essentially a parameter no longer equals a currently claimed value, 2. Equal v. less than (left-tailed test: h0 parameter = some value, h1 parameter < some value, essentially a parameter is less than a currently claimed value, 3. In 2008, 62% of american adults regularly volunteered their time for charity work. A researcher believes that this percentage is different today: this is a two-tailed test, the null hypothesis is h0: p = 0. 62, the alternative hypothesis is h1: p 0. 62, 2. According to a study published in march, 2006 the mean length of a phone call on a cellular telephone was 3. 25 minutes.