CAS EC 101 Lecture Notes - Lecture 8: Budget Constraint, Regional Policy Of The European Union, Demand Curve

1 May 2018
School
Department
Course
Professor

CHAPTER: THE LABOR SUPPLY CURVE
Objective 1: Summary of the Economy
• The economy is composed of two sets of participants: Households & Firms
• The economy is composed of two types of markets: Product Markets & Factor Markets
o These markets are the inverse of each other
• Product Markets – goods/services flow from firms to households
o In this market firms are suppliers and households are demanders
• Factor Markets – goods/services used to produce other goods/services
o In this market households are suppliers (of labor and savings) and firms are
demanders (of the total capital)
• Microeconomics – essentially how people make decisions
Objective 2: Labor Budget Constraint
•
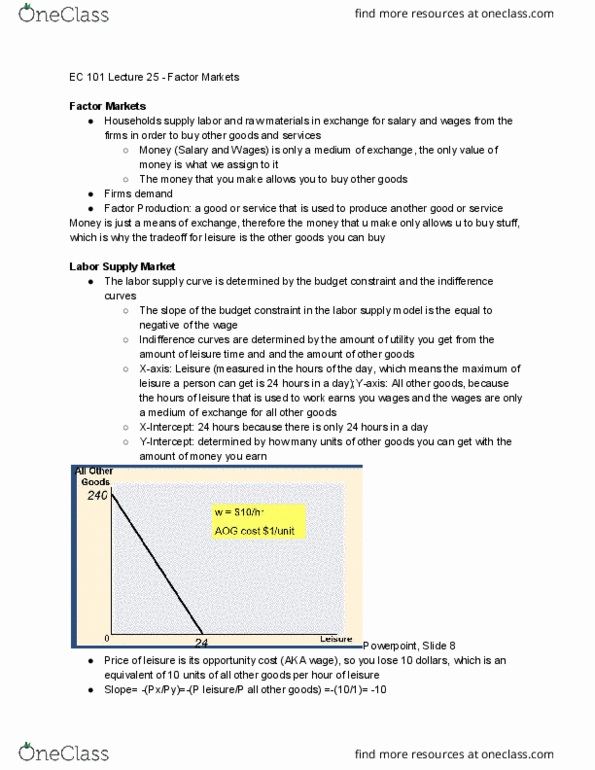
o Horizontal Axis – the value of leisure
▪ Since there are only 24 hours in a day, this intercept (indicating leisure)
can never go past 24 hours
o Vertical Axis – value of all other goods that can possibly be produced
▪ This must consider a consumer’s income (wage/hour) and the cost of
items consumed
• Consumers must make a choice between leisure or consumption
o The decision to work comes from the incentive to make money (consume)
• Slope – measured by
o This is essentially the opportunity cost
o The slope will always be the negative of a consumer’s wage
Objective 3: Wage Change Effects on the Budget Constraint
• The budget constraint pivots around the good whose price did not change
o Vertical Intercept increases/decreases (if the consumer’s wages
increases/decreases)
o Horizontal Intercept will never change, as the amount of leisure is always set
• What happens to the Budget Constraint if wages increases?
find more resources at oneclass.com
find more resources at oneclass.com

o The budget constraint pivots upwards around the horizontal intercept because the
vertical intercept increases
• What happens to the Budget Constraint if wages decreases?
o The budget constraint pivots downwards around the horizontal intercept because
the vertical intercept decreases
• In other words, as consumers’ wages increase, the budget constraint gets steeper
Objective 4: Deriving the Labor Supply Curve
• Graphically:
o x-axis = labor hours supplied
o y-axis = wages
• Budget Constraint – shows the possibilities of what you can do
• Indifference Curve – shows how you feel about the possibilities
• Question: why does labor increase from A to B but decrease from B to C?
o When consumers make more money they will reach a point at which they feel
they do not have to work as much
o As the wage goes above a certain level, consumers will work less and supply less
labor
▪ This results in a backwards bent labor supply curve
Objective 5: Substitution and Income Effects
• ex: substitution and income effects when wages go up, assuming leisure and all other
goods are normal goods
Leisure
Labor
All Other Goods
Substitution
Effect
DECREASE
INCREASE
INCREASE
Income Effect
INCREASE
DECREASE
INCREASE
Combined Effect
INCREASE (if the
IE > SE)
DECREASE (if
the SE > IE)
INCREASE (if
the SE > IE)
DECREASE (if
the IE > SE)
INCREASE
• Row 1 Explanation
o When wages go up, the price (opportunity cost) of leisure goes up as well
• Row 2 Explanation
o When wages go up, you are inherently richer, which will allow you to purchase
more of leisure
find more resources at oneclass.com
find more resources at oneclass.com


56
CAS EC 101 Full Course Notes
Verified Note
56 documents
Document Summary
In other words, as consumers" wages increase, the budget constraint gets steeper. Objective 4: deriving the labor supply curve: graphically, x-axis = labor hours supplied, y-axis = wages, budget constraint shows the possibilities of what you can do. Objective 5: substitution and income effects: ex: substitution and income effects when wages go up, assuming leisure and all other goods are normal goods. Increase/decrease in wages when wages increase/decrease causing movement along. The labor supply curve: an increase in wages = increase in overall wages and movement up along the demand curve, a decrease in wages = decrease in overall wages and movement down along the demand curve. Objective 11: marginal revenue product of labor (mrpl) Involves the marginal product of labor: the additional revenue brought in by one additional hour of labor, formula: mrpl = (cid:3019) = (cid:3030) (cid:3028)(cid:3041) (cid:3041) (cid:3047)(cid:3042)(cid:3047)(cid:3028) (cid:3045)(cid:3049)(cid:3041)(cid:3048) (cid:3030) (cid:3028)(cid:3041) (cid:3041) (cid:3028)(cid:3029)(cid:3042)(cid:3045, l usually = 1, diminishing marginal product of labor.